Bermudan vs Immigrants from Cabo Verde In Labor Force | Age 35-44
COMPARE
Bermudan
Immigrants from Cabo Verde
In Labor Force | Age 35-44
In Labor Force | Age 35-44 Comparison
Bermudans
Immigrants from Cabo Verde
85.3%
IN LABOR FORCE | AGE 35-44
99.9/ 100
METRIC RATING
30th/ 347
METRIC RANK
86.2%
IN LABOR FORCE | AGE 35-44
100.0/ 100
METRIC RATING
4th/ 347
METRIC RANK
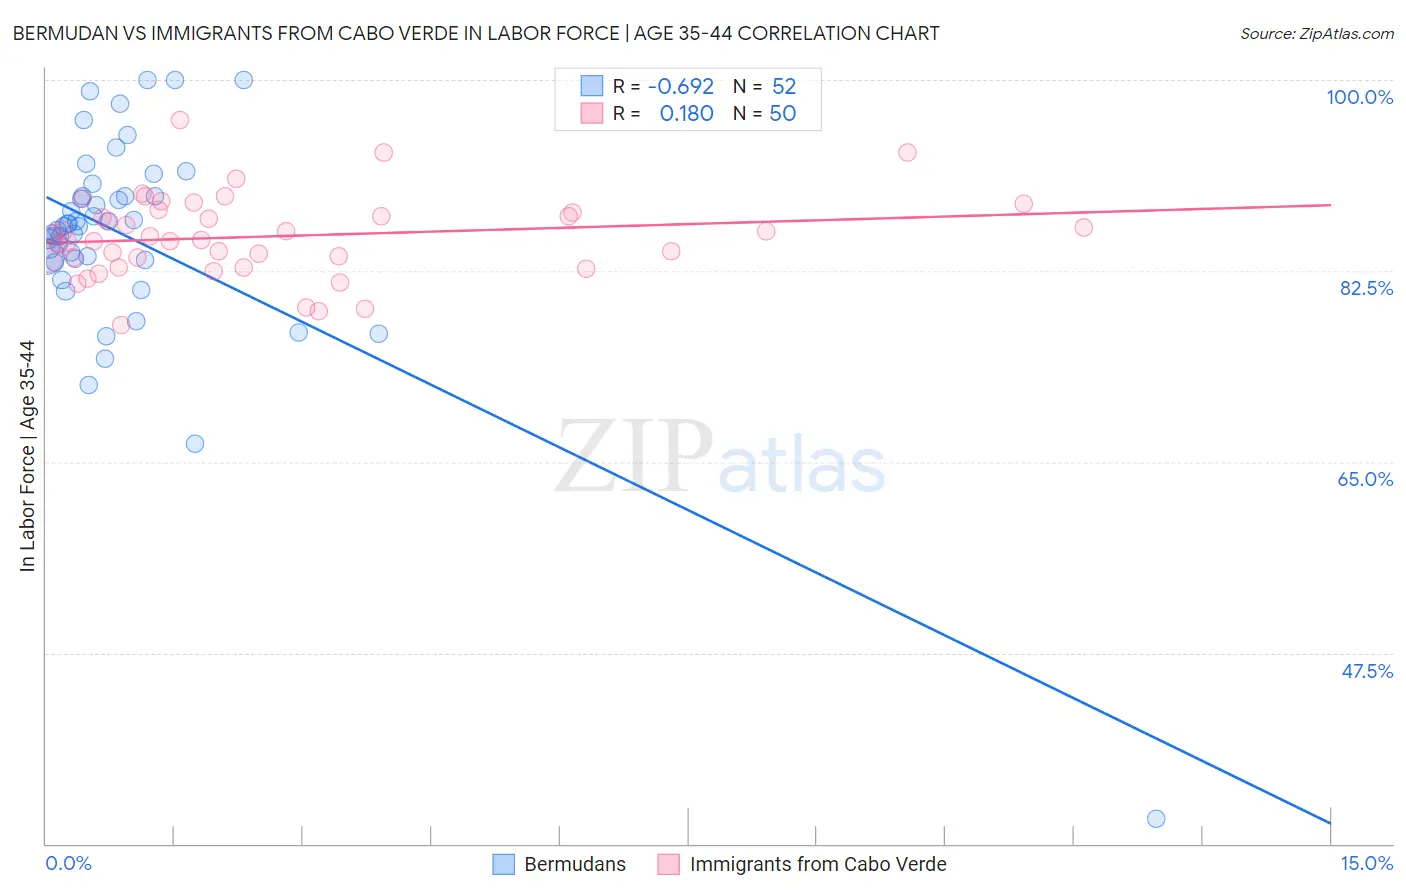
Bermudan vs Immigrants from Cabo Verde In Labor Force | Age 35-44 Correlation Chart
The statistical analysis conducted on geographies consisting of 55,725,453 people shows a significant negative correlation between the proportion of Bermudans and labor force participation rate among population between the ages 35 and 44 in the United States with a correlation coefficient (R) of -0.692 and weighted average of 85.3%. Similarly, the statistical analysis conducted on geographies consisting of 38,133,227 people shows a poor positive correlation between the proportion of Immigrants from Cabo Verde and labor force participation rate among population between the ages 35 and 44 in the United States with a correlation coefficient (R) of 0.180 and weighted average of 86.2%, a difference of 1.1%.
In Labor Force | Age 35-44 Correlation Summary
| Measurement | Bermudan | Immigrants from Cabo Verde |
| Minimum | 32.3% | 77.6% |
| Maximum | 100.0% | 96.3% |
| Range | 67.7% | 18.7% |
| Mean | 85.6% | 85.7% |
| Median | 86.6% | 85.5% |
| Interquartile 25% (IQ1) | 83.6% | 83.8% |
| Interquartile 75% (IQ3) | 89.4% | 87.9% |
| Interquartile Range (IQR) | 5.8% | 4.1% |
| Standard Deviation (Sample) | 10.2% | 3.8% |
| Standard Deviation (Population) | 10.1% | 3.7% |
Similar Demographics by In Labor Force | Age 35-44
Demographics Similar to Bermudans by In Labor Force | Age 35-44
In terms of in labor force | age 35-44, the demographic groups most similar to Bermudans are Czech (85.3%, a difference of 0.0%), Immigrants from India (85.3%, a difference of 0.0%), Cambodian (85.3%, a difference of 0.010%), Ugandan (85.3%, a difference of 0.010%), and Immigrants from Nepal (85.3%, a difference of 0.040%).
| Demographics | Rating | Rank | In Labor Force | Age 35-44 |
| Immigrants | Eastern Africa | 100.0 /100 | #23 | Exceptional 85.4% |
| Latvians | 99.9 /100 | #24 | Exceptional 85.4% |
| Paraguayans | 99.9 /100 | #25 | Exceptional 85.4% |
| Immigrants | Liberia | 99.9 /100 | #26 | Exceptional 85.4% |
| Immigrants | Lithuania | 99.9 /100 | #27 | Exceptional 85.4% |
| Immigrants | Greece | 99.9 /100 | #28 | Exceptional 85.3% |
| Cambodians | 99.9 /100 | #29 | Exceptional 85.3% |
| Bermudans | 99.9 /100 | #30 | Exceptional 85.3% |
| Czechs | 99.9 /100 | #31 | Exceptional 85.3% |
| Immigrants | India | 99.9 /100 | #32 | Exceptional 85.3% |
| Ugandans | 99.9 /100 | #33 | Exceptional 85.3% |
| Immigrants | Nepal | 99.9 /100 | #34 | Exceptional 85.3% |
| Estonians | 99.9 /100 | #35 | Exceptional 85.3% |
| Immigrants | Morocco | 99.8 /100 | #36 | Exceptional 85.2% |
| Kenyans | 99.8 /100 | #37 | Exceptional 85.2% |
Demographics Similar to Immigrants from Cabo Verde by In Labor Force | Age 35-44
In terms of in labor force | age 35-44, the demographic groups most similar to Immigrants from Cabo Verde are Immigrants from Bolivia (86.2%, a difference of 0.030%), Zimbabwean (86.1%, a difference of 0.13%), Bolivian (86.1%, a difference of 0.14%), Immigrants from Sierra Leone (86.1%, a difference of 0.18%), and Luxembourger (86.4%, a difference of 0.22%).
| Demographics | Rating | Rank | In Labor Force | Age 35-44 |
| Sierra Leoneans | 100.0 /100 | #1 | Exceptional 86.4% |
| Luxembourgers | 100.0 /100 | #2 | Exceptional 86.4% |
| Immigrants | Bolivia | 100.0 /100 | #3 | Exceptional 86.2% |
| Immigrants | Cabo Verde | 100.0 /100 | #4 | Exceptional 86.2% |
| Zimbabweans | 100.0 /100 | #5 | Exceptional 86.1% |
| Bolivians | 100.0 /100 | #6 | Exceptional 86.1% |
| Immigrants | Sierra Leone | 100.0 /100 | #7 | Exceptional 86.1% |
| Immigrants | Ethiopia | 100.0 /100 | #8 | Exceptional 85.9% |
| Ethiopians | 100.0 /100 | #9 | Exceptional 85.9% |
| Cape Verdeans | 100.0 /100 | #10 | Exceptional 85.8% |
| Immigrants | Cameroon | 100.0 /100 | #11 | Exceptional 85.8% |
| Liberians | 100.0 /100 | #12 | Exceptional 85.7% |
| Somalis | 100.0 /100 | #13 | Exceptional 85.6% |
| Immigrants | Somalia | 100.0 /100 | #14 | Exceptional 85.6% |
| Norwegians | 100.0 /100 | #15 | Exceptional 85.6% |