Barbadian vs Immigrants from Japan Associate's Degree
COMPARE
Barbadian
Immigrants from Japan
Associate's Degree
Associate's Degree Comparison
Barbadians
Immigrants from Japan
43.9%
ASSOCIATE'S DEGREE
5.8/ 100
METRIC RATING
222nd/ 347
METRIC RANK
54.6%
ASSOCIATE'S DEGREE
100.0/ 100
METRIC RATING
22nd/ 347
METRIC RANK
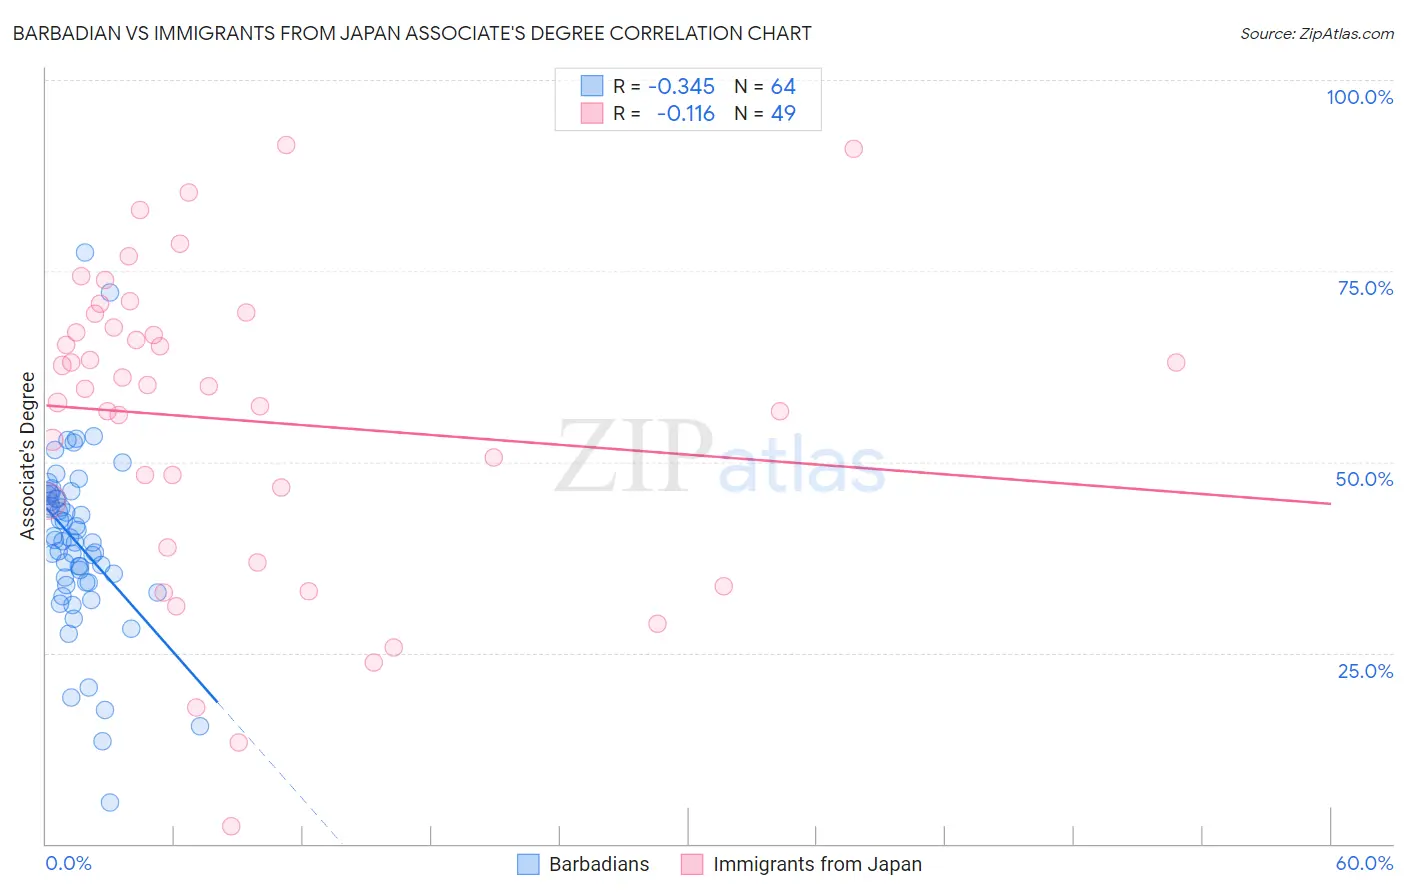
Barbadian vs Immigrants from Japan Associate's Degree Correlation Chart
The statistical analysis conducted on geographies consisting of 141,300,746 people shows a mild negative correlation between the proportion of Barbadians and percentage of population with at least associate's degree education in the United States with a correlation coefficient (R) of -0.345 and weighted average of 43.9%. Similarly, the statistical analysis conducted on geographies consisting of 340,131,347 people shows a poor negative correlation between the proportion of Immigrants from Japan and percentage of population with at least associate's degree education in the United States with a correlation coefficient (R) of -0.116 and weighted average of 54.6%, a difference of 24.2%.
Associate's Degree Correlation Summary
| Measurement | Barbadian | Immigrants from Japan |
| Minimum | 5.4% | 2.2% |
| Maximum | 77.4% | 91.6% |
| Range | 72.1% | 89.3% |
| Mean | 39.4% | 55.5% |
| Median | 39.7% | 60.0% |
| Interquartile 25% (IQ1) | 34.2% | 41.7% |
| Interquartile 75% (IQ3) | 45.4% | 68.5% |
| Interquartile Range (IQR) | 11.2% | 26.8% |
| Standard Deviation (Sample) | 11.7% | 20.1% |
| Standard Deviation (Population) | 11.6% | 19.9% |
Similar Demographics by Associate's Degree
Demographics Similar to Barbadians by Associate's Degree
In terms of associate's degree, the demographic groups most similar to Barbadians are Subsaharan African (43.9%, a difference of 0.10%), West Indian (43.8%, a difference of 0.24%), Immigrants from Western Africa (44.1%, a difference of 0.27%), Guamanian/Chamorro (43.8%, a difference of 0.39%), and Portuguese (44.1%, a difference of 0.47%).
| Demographics | Rating | Rank | Associate's Degree |
| Immigrants | Panama | 12.4 /100 | #215 | Poor 44.7% |
| Immigrants | Nigeria | 11.4 /100 | #216 | Poor 44.6% |
| Immigrants | Immigrants | 10.5 /100 | #217 | Poor 44.5% |
| Spanish | 9.4 /100 | #218 | Tragic 44.4% |
| Whites/Caucasians | 7.5 /100 | #219 | Tragic 44.2% |
| Portuguese | 7.2 /100 | #220 | Tragic 44.1% |
| Immigrants | Western Africa | 6.6 /100 | #221 | Tragic 44.1% |
| Barbadians | 5.8 /100 | #222 | Tragic 43.9% |
| Sub-Saharan Africans | 5.5 /100 | #223 | Tragic 43.9% |
| West Indians | 5.2 /100 | #224 | Tragic 43.8% |
| Guamanians/Chamorros | 4.8 /100 | #225 | Tragic 43.8% |
| Immigrants | Burma/Myanmar | 4.3 /100 | #226 | Tragic 43.7% |
| Trinidadians and Tobagonians | 4.0 /100 | #227 | Tragic 43.6% |
| Hmong | 3.2 /100 | #228 | Tragic 43.4% |
| Immigrants | Trinidad and Tobago | 3.0 /100 | #229 | Tragic 43.3% |
Demographics Similar to Immigrants from Japan by Associate's Degree
In terms of associate's degree, the demographic groups most similar to Immigrants from Japan are Burmese (54.6%, a difference of 0.0%), Immigrants from Sweden (54.6%, a difference of 0.030%), Immigrants from Korea (54.5%, a difference of 0.090%), Cambodian (54.6%, a difference of 0.10%), and Immigrants from Ireland (54.7%, a difference of 0.12%).
| Demographics | Rating | Rank | Associate's Degree |
| Immigrants | Eastern Asia | 100.0 /100 | #15 | Exceptional 55.4% |
| Soviet Union | 100.0 /100 | #16 | Exceptional 55.1% |
| Eastern Europeans | 100.0 /100 | #17 | Exceptional 55.0% |
| Indians (Asian) | 100.0 /100 | #18 | Exceptional 54.8% |
| Immigrants | Ireland | 100.0 /100 | #19 | Exceptional 54.7% |
| Cambodians | 100.0 /100 | #20 | Exceptional 54.6% |
| Immigrants | Sweden | 100.0 /100 | #21 | Exceptional 54.6% |
| Immigrants | Japan | 100.0 /100 | #22 | Exceptional 54.6% |
| Burmese | 100.0 /100 | #23 | Exceptional 54.6% |
| Immigrants | Korea | 100.0 /100 | #24 | Exceptional 54.5% |
| Immigrants | Switzerland | 100.0 /100 | #25 | Exceptional 54.5% |
| Immigrants | Belgium | 100.0 /100 | #26 | Exceptional 54.5% |
| Latvians | 100.0 /100 | #27 | Exceptional 53.9% |
| Turks | 100.0 /100 | #28 | Exceptional 53.9% |
| Immigrants | France | 100.0 /100 | #29 | Exceptional 53.9% |