Central American Indian vs Immigrants from Czechoslovakia Unemployment Among Ages 30 to 34 years
COMPARE
Central American Indian
Immigrants from Czechoslovakia
Unemployment Among Ages 30 to 34 years
Unemployment Among Ages 30 to 34 years Comparison
Central American Indians
Immigrants from Czechoslovakia
6.4%
UNEMPLOYMENT AMONG AGES 30 TO 34 YEARS
0.0/ 100
METRIC RATING
286th/ 347
METRIC RANK
5.3%
UNEMPLOYMENT AMONG AGES 30 TO 34 YEARS
89.5/ 100
METRIC RATING
100th/ 347
METRIC RANK
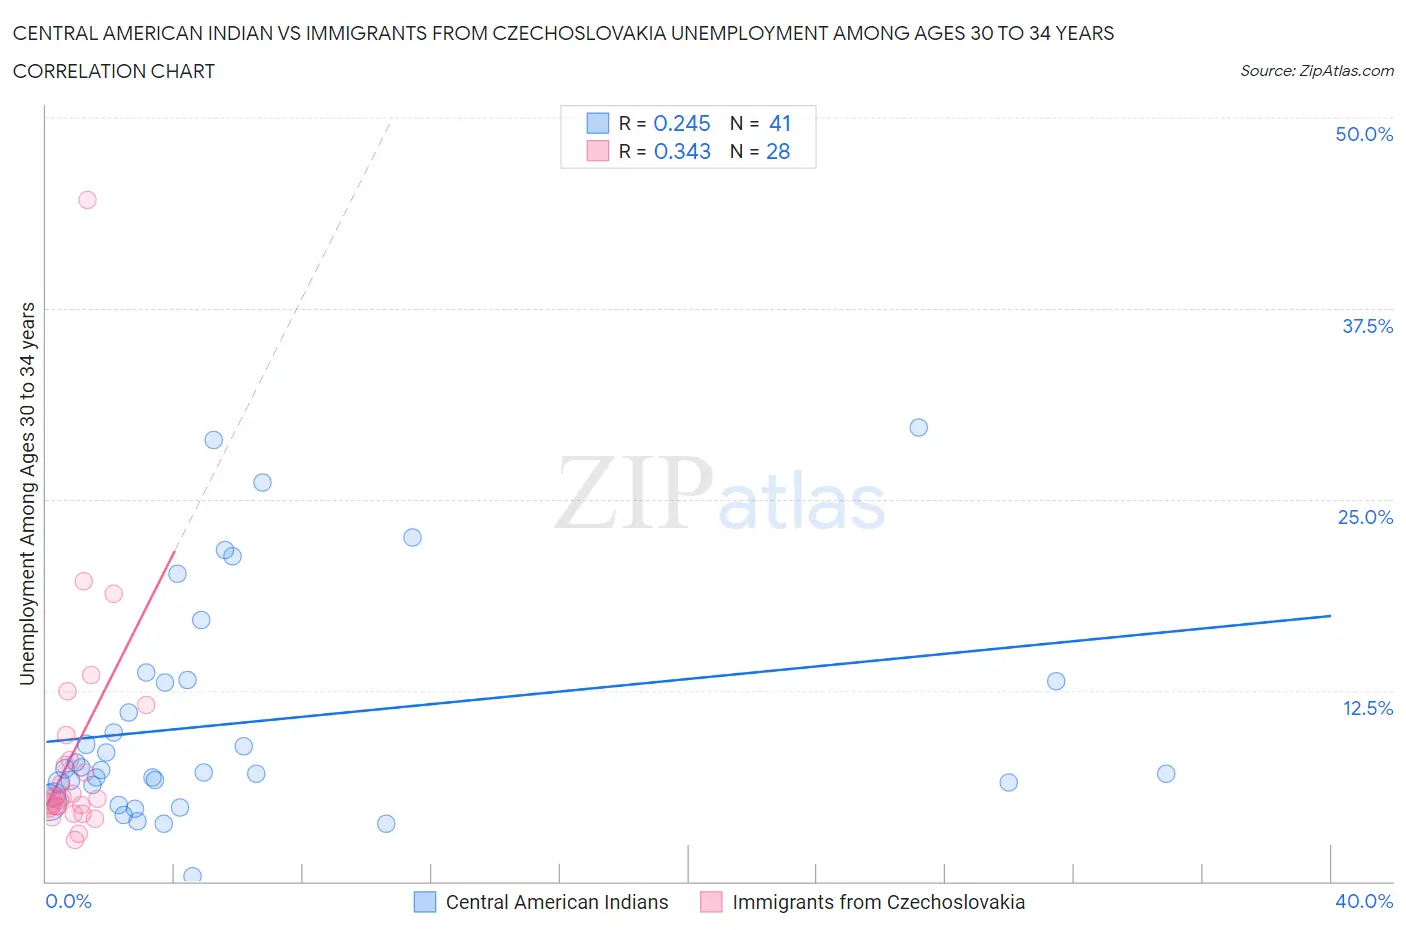
Central American Indian vs Immigrants from Czechoslovakia Unemployment Among Ages 30 to 34 years Correlation Chart
The statistical analysis conducted on geographies consisting of 314,351,808 people shows a weak positive correlation between the proportion of Central American Indians and unemployment rate among population between the ages 30 and 34 in the United States with a correlation coefficient (R) of 0.245 and weighted average of 6.4%. Similarly, the statistical analysis conducted on geographies consisting of 189,322,017 people shows a mild positive correlation between the proportion of Immigrants from Czechoslovakia and unemployment rate among population between the ages 30 and 34 in the United States with a correlation coefficient (R) of 0.343 and weighted average of 5.3%, a difference of 22.3%.
Unemployment Among Ages 30 to 34 years Correlation Summary
| Measurement | Central American Indian | Immigrants from Czechoslovakia |
| Minimum | 0.30% | 2.7% |
| Maximum | 29.7% | 44.6% |
| Range | 29.4% | 41.9% |
| Mean | 10.4% | 8.6% |
| Median | 7.2% | 5.4% |
| Interquartile 25% (IQ1) | 6.0% | 4.9% |
| Interquartile 75% (IQ3) | 13.1% | 8.7% |
| Interquartile Range (IQR) | 7.1% | 3.8% |
| Standard Deviation (Sample) | 7.3% | 8.3% |
| Standard Deviation (Population) | 7.2% | 8.1% |
Similar Demographics by Unemployment Among Ages 30 to 34 years
Demographics Similar to Central American Indians by Unemployment Among Ages 30 to 34 years
In terms of unemployment among ages 30 to 34 years, the demographic groups most similar to Central American Indians are Immigrants from West Indies (6.4%, a difference of 0.020%), Choctaw (6.4%, a difference of 0.040%), Senegalese (6.4%, a difference of 0.060%), Menominee (6.4%, a difference of 0.10%), and Immigrants from Bangladesh (6.4%, a difference of 0.14%).
| Demographics | Rating | Rank | Unemployment Among Ages 30 to 34 years |
| Cree | 0.0 /100 | #279 | Tragic 6.4% |
| Cherokee | 0.0 /100 | #280 | Tragic 6.4% |
| Immigrants | Caribbean | 0.0 /100 | #281 | Tragic 6.4% |
| Africans | 0.0 /100 | #282 | Tragic 6.4% |
| Hispanics or Latinos | 0.0 /100 | #283 | Tragic 6.4% |
| Immigrants | Bangladesh | 0.0 /100 | #284 | Tragic 6.4% |
| Choctaw | 0.0 /100 | #285 | Tragic 6.4% |
| Central American Indians | 0.0 /100 | #286 | Tragic 6.4% |
| Immigrants | West Indies | 0.0 /100 | #287 | Tragic 6.4% |
| Senegalese | 0.0 /100 | #288 | Tragic 6.4% |
| Menominee | 0.0 /100 | #289 | Tragic 6.4% |
| Immigrants | Trinidad and Tobago | 0.0 /100 | #290 | Tragic 6.5% |
| Jamaicans | 0.0 /100 | #291 | Tragic 6.5% |
| Vietnamese | 0.0 /100 | #292 | Tragic 6.5% |
| West Indians | 0.0 /100 | #293 | Tragic 6.5% |
Demographics Similar to Immigrants from Czechoslovakia by Unemployment Among Ages 30 to 34 years
In terms of unemployment among ages 30 to 34 years, the demographic groups most similar to Immigrants from Czechoslovakia are British (5.3%, a difference of 0.080%), Immigrants from Switzerland (5.3%, a difference of 0.13%), Immigrants from Jordan (5.3%, a difference of 0.14%), Immigrants from Ireland (5.2%, a difference of 0.21%), and Immigrants from North Macedonia (5.2%, a difference of 0.27%).
| Demographics | Rating | Rank | Unemployment Among Ages 30 to 34 years |
| Laotians | 92.4 /100 | #93 | Exceptional 5.2% |
| Maltese | 92.3 /100 | #94 | Exceptional 5.2% |
| Kenyans | 92.1 /100 | #95 | Exceptional 5.2% |
| Mongolians | 91.7 /100 | #96 | Exceptional 5.2% |
| Europeans | 91.7 /100 | #97 | Exceptional 5.2% |
| Immigrants | North Macedonia | 90.9 /100 | #98 | Exceptional 5.2% |
| Immigrants | Ireland | 90.6 /100 | #99 | Exceptional 5.2% |
| Immigrants | Czechoslovakia | 89.5 /100 | #100 | Excellent 5.3% |
| British | 89.1 /100 | #101 | Excellent 5.3% |
| Immigrants | Switzerland | 88.8 /100 | #102 | Excellent 5.3% |
| Immigrants | Jordan | 88.8 /100 | #103 | Excellent 5.3% |
| Northern Europeans | 87.9 /100 | #104 | Excellent 5.3% |
| Argentineans | 87.9 /100 | #105 | Excellent 5.3% |
| Croatians | 87.6 /100 | #106 | Excellent 5.3% |
| Icelanders | 87.2 /100 | #107 | Excellent 5.3% |