Bahamian vs Immigrants from Nepal Unemployment Among Ages 30 to 34 years
COMPARE
Bahamian
Immigrants from Nepal
Unemployment Among Ages 30 to 34 years
Unemployment Among Ages 30 to 34 years Comparison
Bahamians
Immigrants from Nepal
6.6%
UNEMPLOYMENT AMONG AGES 30 TO 34 YEARS
0.0/ 100
METRIC RATING
300th/ 347
METRIC RANK
4.7%
UNEMPLOYMENT AMONG AGES 30 TO 34 YEARS
100.0/ 100
METRIC RATING
4th/ 347
METRIC RANK
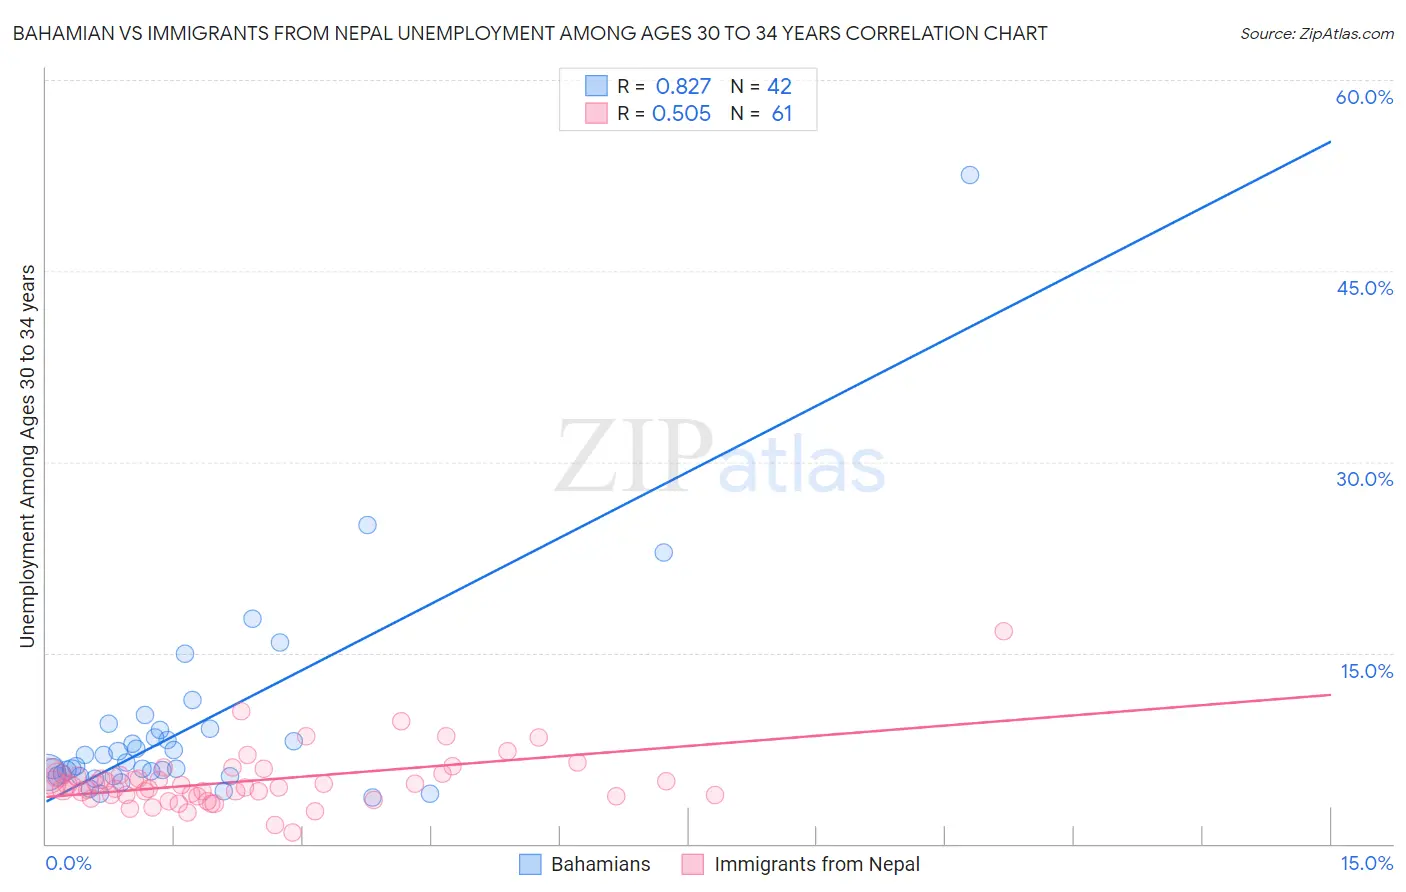
Bahamian vs Immigrants from Nepal Unemployment Among Ages 30 to 34 years Correlation Chart
The statistical analysis conducted on geographies consisting of 110,229,409 people shows a very strong positive correlation between the proportion of Bahamians and unemployment rate among population between the ages 30 and 34 in the United States with a correlation coefficient (R) of 0.827 and weighted average of 6.6%. Similarly, the statistical analysis conducted on geographies consisting of 182,258,798 people shows a substantial positive correlation between the proportion of Immigrants from Nepal and unemployment rate among population between the ages 30 and 34 in the United States with a correlation coefficient (R) of 0.505 and weighted average of 4.7%, a difference of 40.9%.
Unemployment Among Ages 30 to 34 years Correlation Summary
| Measurement | Bahamian | Immigrants from Nepal |
| Minimum | 3.6% | 0.90% |
| Maximum | 52.5% | 16.7% |
| Range | 48.9% | 15.8% |
| Mean | 9.1% | 4.9% |
| Median | 6.3% | 4.5% |
| Interquartile 25% (IQ1) | 5.3% | 3.8% |
| Interquartile 75% (IQ3) | 8.9% | 5.4% |
| Interquartile Range (IQR) | 3.6% | 1.7% |
| Standard Deviation (Sample) | 8.3% | 2.3% |
| Standard Deviation (Population) | 8.2% | 2.3% |
Similar Demographics by Unemployment Among Ages 30 to 34 years
Demographics Similar to Bahamians by Unemployment Among Ages 30 to 34 years
In terms of unemployment among ages 30 to 34 years, the demographic groups most similar to Bahamians are Dutch West Indian (6.6%, a difference of 0.050%), Immigrants from Barbados (6.6%, a difference of 0.15%), Belizean (6.6%, a difference of 0.29%), Creek (6.6%, a difference of 0.40%), and Immigrants from Jamaica (6.5%, a difference of 0.50%).
| Demographics | Rating | Rank | Unemployment Among Ages 30 to 34 years |
| West Indians | 0.0 /100 | #293 | Tragic 6.5% |
| Barbadians | 0.0 /100 | #294 | Tragic 6.5% |
| Trinidadians and Tobagonians | 0.0 /100 | #295 | Tragic 6.5% |
| Immigrants | Jamaica | 0.0 /100 | #296 | Tragic 6.5% |
| Creek | 0.0 /100 | #297 | Tragic 6.6% |
| Immigrants | Barbados | 0.0 /100 | #298 | Tragic 6.6% |
| Dutch West Indians | 0.0 /100 | #299 | Tragic 6.6% |
| Bahamians | 0.0 /100 | #300 | Tragic 6.6% |
| Belizeans | 0.0 /100 | #301 | Tragic 6.6% |
| Delaware | 0.0 /100 | #302 | Tragic 6.7% |
| Cajuns | 0.0 /100 | #303 | Tragic 6.7% |
| Kiowa | 0.0 /100 | #304 | Tragic 6.7% |
| Paiute | 0.0 /100 | #305 | Tragic 6.7% |
| Immigrants | Armenia | 0.0 /100 | #306 | Tragic 6.8% |
| Immigrants | Belize | 0.0 /100 | #307 | Tragic 6.9% |
Demographics Similar to Immigrants from Nepal by Unemployment Among Ages 30 to 34 years
In terms of unemployment among ages 30 to 34 years, the demographic groups most similar to Immigrants from Nepal are Venezuelan (4.7%, a difference of 0.64%), Immigrants from Venezuela (4.6%, a difference of 0.67%), Immigrants from Bosnia and Herzegovina (4.7%, a difference of 0.87%), Thai (4.7%, a difference of 1.1%), and Immigrants from Eritrea (4.7%, a difference of 1.3%).
| Demographics | Rating | Rank | Unemployment Among Ages 30 to 34 years |
| Immigrants | India | 100.0 /100 | #1 | Exceptional 4.5% |
| Sudanese | 100.0 /100 | #2 | Exceptional 4.6% |
| Immigrants | Venezuela | 100.0 /100 | #3 | Exceptional 4.6% |
| Immigrants | Nepal | 100.0 /100 | #4 | Exceptional 4.7% |
| Venezuelans | 100.0 /100 | #5 | Exceptional 4.7% |
| Immigrants | Bosnia and Herzegovina | 100.0 /100 | #6 | Exceptional 4.7% |
| Thais | 100.0 /100 | #7 | Exceptional 4.7% |
| Immigrants | Eritrea | 100.0 /100 | #8 | Exceptional 4.7% |
| Bulgarians | 99.9 /100 | #9 | Exceptional 4.7% |
| Tongans | 99.9 /100 | #10 | Exceptional 4.8% |
| Immigrants | Bolivia | 99.9 /100 | #11 | Exceptional 4.8% |
| Filipinos | 99.9 /100 | #12 | Exceptional 4.8% |
| Cambodians | 99.9 /100 | #13 | Exceptional 4.8% |
| Luxembourgers | 99.9 /100 | #14 | Exceptional 4.8% |
| Okinawans | 99.9 /100 | #15 | Exceptional 4.8% |