Alaska Native vs Immigrants from Czechoslovakia Unemployment Among Ages 30 to 34 years
COMPARE
Alaska Native
Immigrants from Czechoslovakia
Unemployment Among Ages 30 to 34 years
Unemployment Among Ages 30 to 34 years Comparison
Alaska Natives
Immigrants from Czechoslovakia
8.5%
UNEMPLOYMENT AMONG AGES 30 TO 34 YEARS
0.0/ 100
METRIC RATING
334th/ 347
METRIC RANK
5.3%
UNEMPLOYMENT AMONG AGES 30 TO 34 YEARS
89.5/ 100
METRIC RATING
100th/ 347
METRIC RANK
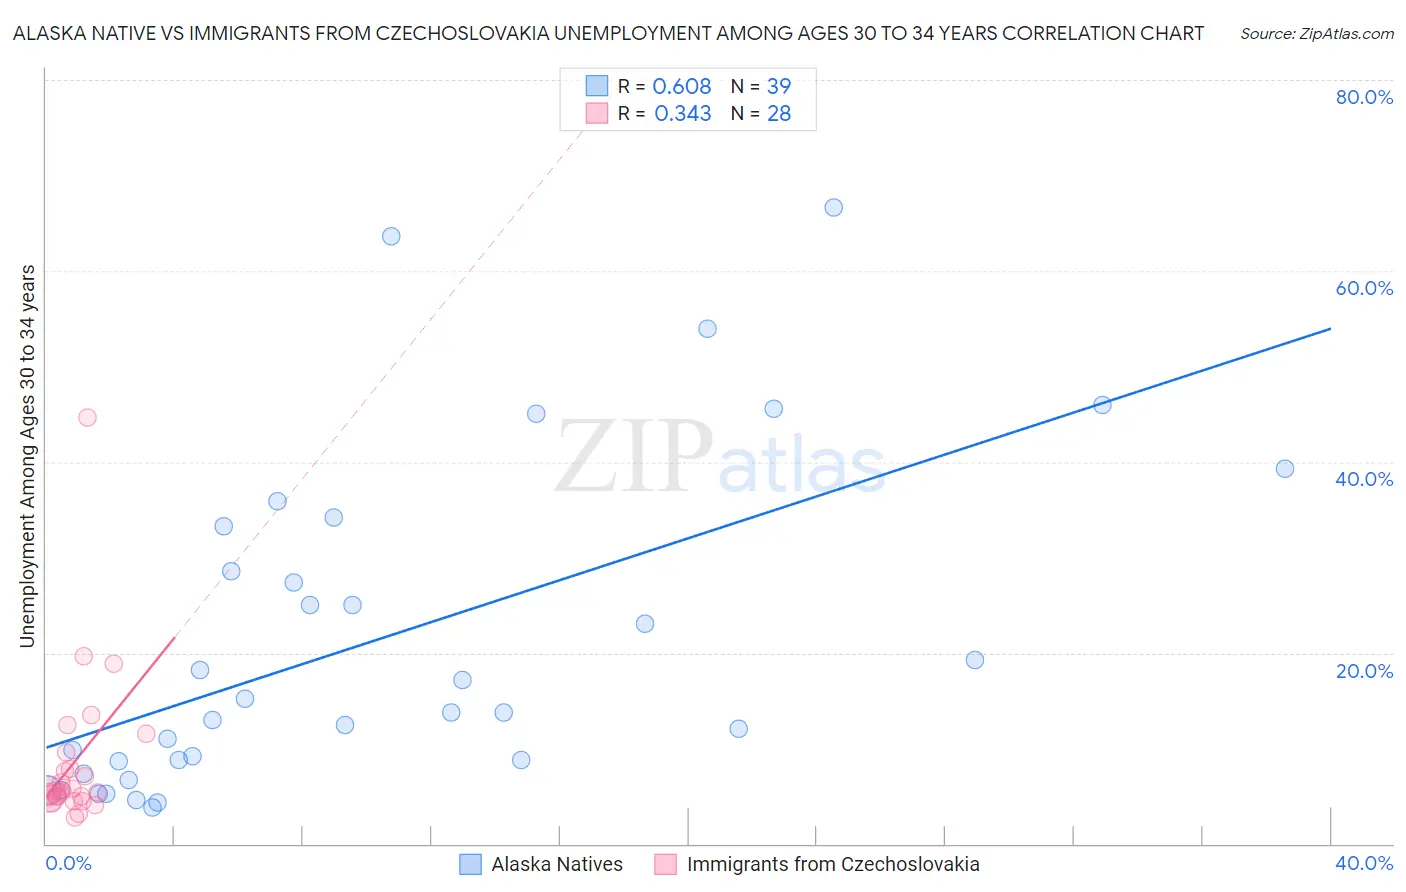
Alaska Native vs Immigrants from Czechoslovakia Unemployment Among Ages 30 to 34 years Correlation Chart
The statistical analysis conducted on geographies consisting of 75,749,342 people shows a significant positive correlation between the proportion of Alaska Natives and unemployment rate among population between the ages 30 and 34 in the United States with a correlation coefficient (R) of 0.608 and weighted average of 8.5%. Similarly, the statistical analysis conducted on geographies consisting of 189,322,017 people shows a mild positive correlation between the proportion of Immigrants from Czechoslovakia and unemployment rate among population between the ages 30 and 34 in the United States with a correlation coefficient (R) of 0.343 and weighted average of 5.3%, a difference of 61.5%.
Unemployment Among Ages 30 to 34 years Correlation Summary
| Measurement | Alaska Native | Immigrants from Czechoslovakia |
| Minimum | 3.8% | 2.7% |
| Maximum | 66.7% | 44.6% |
| Range | 62.9% | 41.9% |
| Mean | 21.3% | 8.6% |
| Median | 13.8% | 5.4% |
| Interquartile 25% (IQ1) | 8.7% | 4.9% |
| Interquartile 75% (IQ3) | 33.3% | 8.7% |
| Interquartile Range (IQR) | 24.6% | 3.8% |
| Standard Deviation (Sample) | 17.2% | 8.3% |
| Standard Deviation (Population) | 16.9% | 8.1% |
Similar Demographics by Unemployment Among Ages 30 to 34 years
Demographics Similar to Alaska Natives by Unemployment Among Ages 30 to 34 years
In terms of unemployment among ages 30 to 34 years, the demographic groups most similar to Alaska Natives are Pueblo (8.3%, a difference of 2.7%), Native/Alaskan (8.2%, a difference of 3.1%), Puerto Rican (8.9%, a difference of 4.5%), Sioux (8.0%, a difference of 5.8%), and Colville (9.0%, a difference of 6.5%).
| Demographics | Rating | Rank | Unemployment Among Ages 30 to 34 years |
| Immigrants | Dominican Republic | 0.0 /100 | #327 | Tragic 7.7% |
| Chippewa | 0.0 /100 | #328 | Tragic 7.8% |
| Cheyenne | 0.0 /100 | #329 | Tragic 7.8% |
| Shoshone | 0.0 /100 | #330 | Tragic 7.9% |
| Sioux | 0.0 /100 | #331 | Tragic 8.0% |
| Natives/Alaskans | 0.0 /100 | #332 | Tragic 8.2% |
| Pueblo | 0.0 /100 | #333 | Tragic 8.3% |
| Alaska Natives | 0.0 /100 | #334 | Tragic 8.5% |
| Puerto Ricans | 0.0 /100 | #335 | Tragic 8.9% |
| Colville | 0.0 /100 | #336 | Tragic 9.0% |
| Pima | 0.0 /100 | #337 | Tragic 9.6% |
| Yakama | 0.0 /100 | #338 | Tragic 9.8% |
| Tohono O'odham | 0.0 /100 | #339 | Tragic 9.8% |
| Crow | 0.0 /100 | #340 | Tragic 10.3% |
| Navajo | 0.0 /100 | #341 | Tragic 10.6% |
Demographics Similar to Immigrants from Czechoslovakia by Unemployment Among Ages 30 to 34 years
In terms of unemployment among ages 30 to 34 years, the demographic groups most similar to Immigrants from Czechoslovakia are British (5.3%, a difference of 0.080%), Immigrants from Switzerland (5.3%, a difference of 0.13%), Immigrants from Jordan (5.3%, a difference of 0.14%), Immigrants from Ireland (5.2%, a difference of 0.21%), and Immigrants from North Macedonia (5.2%, a difference of 0.27%).
| Demographics | Rating | Rank | Unemployment Among Ages 30 to 34 years |
| Laotians | 92.4 /100 | #93 | Exceptional 5.2% |
| Maltese | 92.3 /100 | #94 | Exceptional 5.2% |
| Kenyans | 92.1 /100 | #95 | Exceptional 5.2% |
| Mongolians | 91.7 /100 | #96 | Exceptional 5.2% |
| Europeans | 91.7 /100 | #97 | Exceptional 5.2% |
| Immigrants | North Macedonia | 90.9 /100 | #98 | Exceptional 5.2% |
| Immigrants | Ireland | 90.6 /100 | #99 | Exceptional 5.2% |
| Immigrants | Czechoslovakia | 89.5 /100 | #100 | Excellent 5.3% |
| British | 89.1 /100 | #101 | Excellent 5.3% |
| Immigrants | Switzerland | 88.8 /100 | #102 | Excellent 5.3% |
| Immigrants | Jordan | 88.8 /100 | #103 | Excellent 5.3% |
| Northern Europeans | 87.9 /100 | #104 | Excellent 5.3% |
| Argentineans | 87.9 /100 | #105 | Excellent 5.3% |
| Croatians | 87.6 /100 | #106 | Excellent 5.3% |
| Icelanders | 87.2 /100 | #107 | Excellent 5.3% |