Austrian vs Sri Lankan Female Unemployment
COMPARE
Austrian
Sri Lankan
Female Unemployment
Female Unemployment Comparison
Austrians
Sri Lankans
4.9%
FEMALE UNEMPLOYMENT
99.3/ 100
METRIC RATING
45th/ 347
METRIC RANK
5.2%
FEMALE UNEMPLOYMENT
59.4/ 100
METRIC RATING
168th/ 347
METRIC RANK
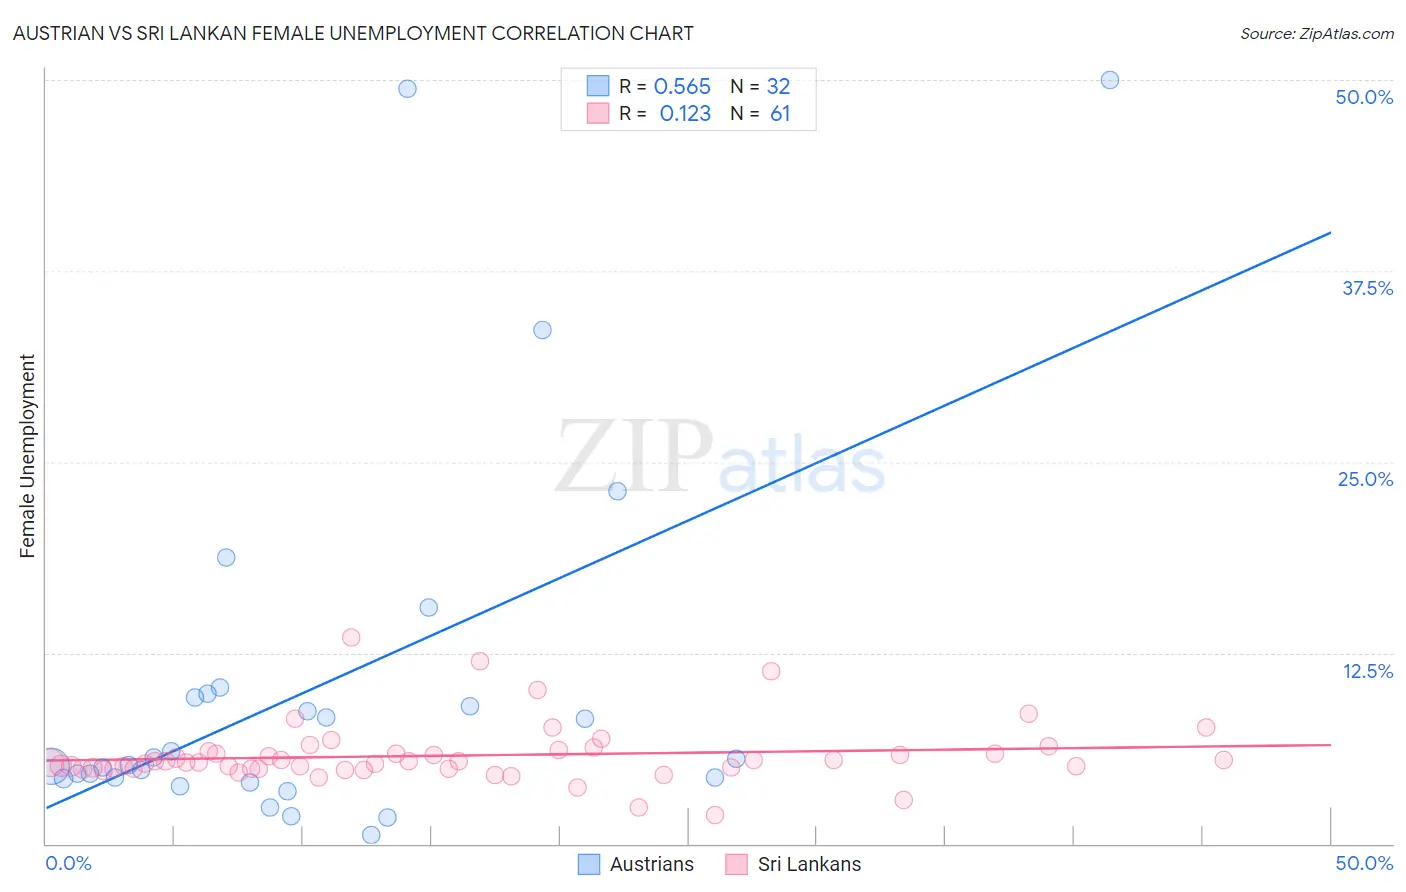
Austrian vs Sri Lankan Female Unemployment Correlation Chart
The statistical analysis conducted on geographies consisting of 448,029,522 people shows a substantial positive correlation between the proportion of Austrians and unemploymnet rate among females in the United States with a correlation coefficient (R) of 0.565 and weighted average of 4.9%. Similarly, the statistical analysis conducted on geographies consisting of 438,500,315 people shows a poor positive correlation between the proportion of Sri Lankans and unemploymnet rate among females in the United States with a correlation coefficient (R) of 0.123 and weighted average of 5.2%, a difference of 7.5%.
Female Unemployment Correlation Summary
| Measurement | Austrian | Sri Lankan |
| Minimum | 0.60% | 1.9% |
| Maximum | 50.0% | 13.5% |
| Range | 49.4% | 11.6% |
| Mean | 10.4% | 5.8% |
| Median | 5.4% | 5.3% |
| Interquartile 25% (IQ1) | 4.3% | 4.9% |
| Interquartile 75% (IQ3) | 9.7% | 6.0% |
| Interquartile Range (IQR) | 5.4% | 1.1% |
| Standard Deviation (Sample) | 12.3% | 2.0% |
| Standard Deviation (Population) | 12.1% | 1.9% |
Similar Demographics by Female Unemployment
Demographics Similar to Austrians by Female Unemployment
In terms of female unemployment, the demographic groups most similar to Austrians are Immigrants from Bulgaria (4.9%, a difference of 0.030%), Greek (4.9%, a difference of 0.080%), Okinawan (4.9%, a difference of 0.11%), Eastern European (4.9%, a difference of 0.18%), and Thai (4.9%, a difference of 0.31%).
| Demographics | Rating | Rank | Female Unemployment |
| Northern Europeans | 99.6 /100 | #38 | Exceptional 4.8% |
| Scotch-Irish | 99.6 /100 | #39 | Exceptional 4.8% |
| French | 99.6 /100 | #40 | Exceptional 4.8% |
| Tongans | 99.5 /100 | #41 | Exceptional 4.8% |
| Italians | 99.5 /100 | #42 | Exceptional 4.8% |
| Eastern Europeans | 99.4 /100 | #43 | Exceptional 4.9% |
| Greeks | 99.4 /100 | #44 | Exceptional 4.9% |
| Austrians | 99.3 /100 | #45 | Exceptional 4.9% |
| Immigrants | Bulgaria | 99.3 /100 | #46 | Exceptional 4.9% |
| Okinawans | 99.3 /100 | #47 | Exceptional 4.9% |
| Thais | 99.2 /100 | #48 | Exceptional 4.9% |
| Australians | 99.2 /100 | #49 | Exceptional 4.9% |
| Immigrants | Cuba | 99.1 /100 | #50 | Exceptional 4.9% |
| Cambodians | 99.1 /100 | #51 | Exceptional 4.9% |
| Slavs | 99.1 /100 | #52 | Exceptional 4.9% |
Demographics Similar to Sri Lankans by Female Unemployment
In terms of female unemployment, the demographic groups most similar to Sri Lankans are Immigrants from Chile (5.2%, a difference of 0.030%), Immigrants from Thailand (5.2%, a difference of 0.17%), Syrian (5.2%, a difference of 0.21%), Native Hawaiian (5.2%, a difference of 0.21%), and Spanish (5.2%, a difference of 0.22%).
| Demographics | Rating | Rank | Female Unemployment |
| Immigrants | Pakistan | 66.7 /100 | #161 | Good 5.2% |
| Potawatomi | 65.9 /100 | #162 | Good 5.2% |
| Immigrants | Asia | 64.3 /100 | #163 | Good 5.2% |
| Bangladeshis | 64.3 /100 | #164 | Good 5.2% |
| Syrians | 62.8 /100 | #165 | Good 5.2% |
| Native Hawaiians | 62.7 /100 | #166 | Good 5.2% |
| Immigrants | Thailand | 62.1 /100 | #167 | Good 5.2% |
| Sri Lankans | 59.4 /100 | #168 | Average 5.2% |
| Immigrants | Chile | 59.0 /100 | #169 | Average 5.2% |
| Spanish | 55.9 /100 | #170 | Average 5.2% |
| Immigrants | Denmark | 55.0 /100 | #171 | Average 5.2% |
| Immigrants | Uganda | 50.7 /100 | #172 | Average 5.3% |
| Iranians | 50.4 /100 | #173 | Average 5.3% |
| Immigrants | Poland | 50.0 /100 | #174 | Average 5.3% |
| Immigrants | Laos | 47.5 /100 | #175 | Average 5.3% |