Armenian vs Mexican Disability Age Over 75
COMPARE
Armenian
Mexican
Disability Age Over 75
Disability Age Over 75 Comparison
Armenians
Mexicans
50.0%
DISABILITY AGE OVER 75
0.0/ 100
METRIC RATING
297th/ 347
METRIC RANK
51.1%
DISABILITY AGE OVER 75
0.0/ 100
METRIC RATING
315th/ 347
METRIC RANK
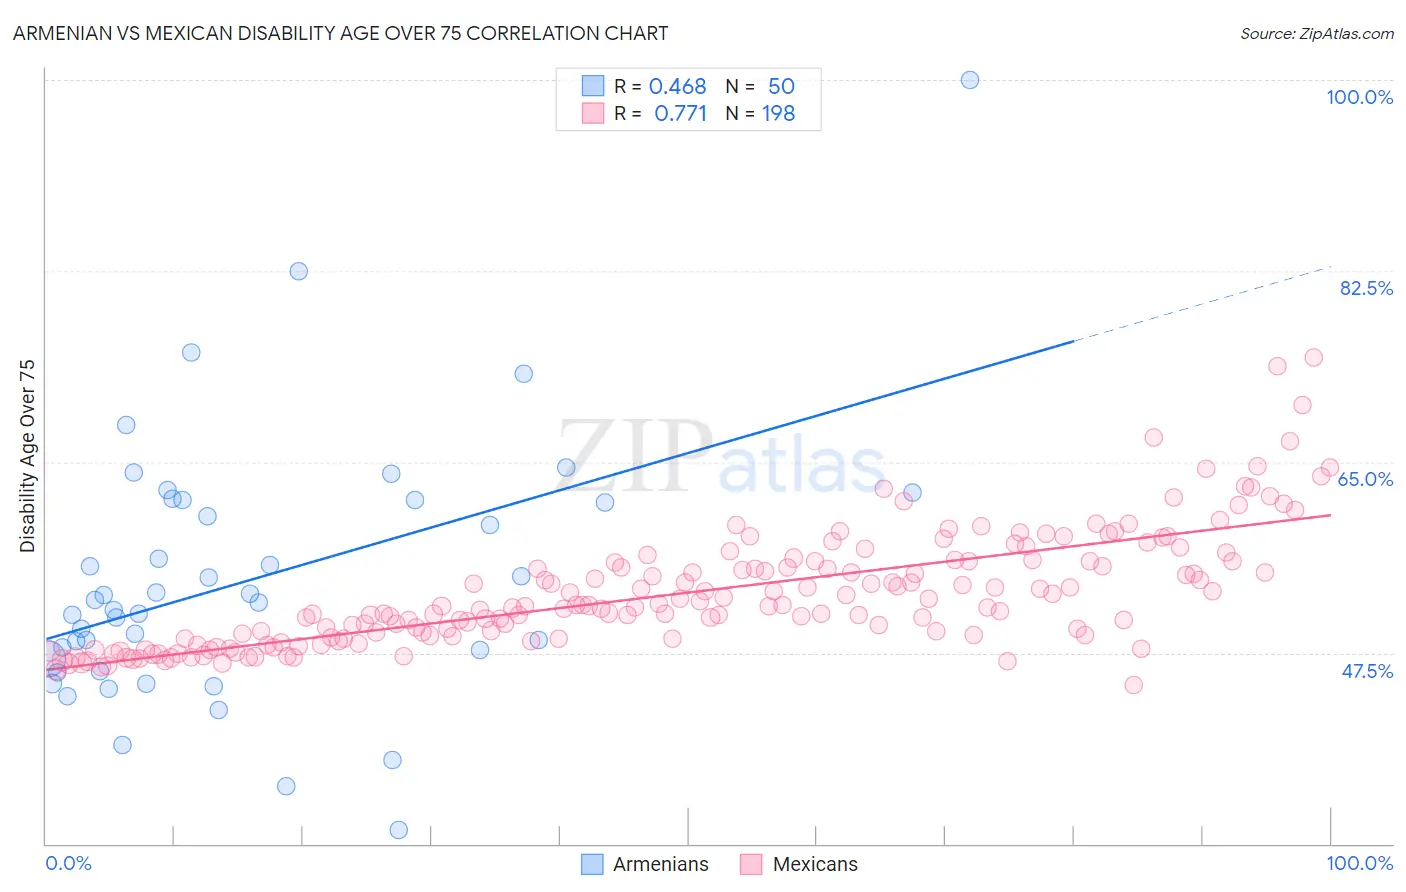
Armenian vs Mexican Disability Age Over 75 Correlation Chart
The statistical analysis conducted on geographies consisting of 310,578,172 people shows a moderate positive correlation between the proportion of Armenians and percentage of population with a disability over the age of 75 in the United States with a correlation coefficient (R) of 0.468 and weighted average of 50.0%. Similarly, the statistical analysis conducted on geographies consisting of 562,773,685 people shows a strong positive correlation between the proportion of Mexicans and percentage of population with a disability over the age of 75 in the United States with a correlation coefficient (R) of 0.771 and weighted average of 51.1%, a difference of 2.2%.
Disability Age Over 75 Correlation Summary
| Measurement | Armenian | Mexican |
| Minimum | 31.2% | 44.5% |
| Maximum | 100.0% | 74.6% |
| Range | 68.8% | 30.1% |
| Mean | 54.2% | 53.0% |
| Median | 52.2% | 51.7% |
| Interquartile 25% (IQ1) | 47.0% | 48.9% |
| Interquartile 75% (IQ3) | 61.5% | 55.9% |
| Interquartile Range (IQR) | 14.5% | 6.9% |
| Standard Deviation (Sample) | 12.0% | 5.3% |
| Standard Deviation (Population) | 11.9% | 5.3% |
Demographics Similar to Armenians and Mexicans by Disability Age Over 75
In terms of disability age over 75, the demographic groups most similar to Armenians are Mexican American Indian (50.0%, a difference of 0.030%), Marshallese (50.1%, a difference of 0.050%), Immigrants from Micronesia (50.1%, a difference of 0.12%), Cape Verdean (50.1%, a difference of 0.16%), and Dominican (50.2%, a difference of 0.22%). Similarly, the demographic groups most similar to Mexicans are Immigrants from Mexico (51.1%, a difference of 0.050%), Chickasaw (51.2%, a difference of 0.14%), Immigrants from the Azores (50.9%, a difference of 0.42%), Cheyenne (50.9%, a difference of 0.47%), and Cajun (50.7%, a difference of 0.93%).
| Demographics | Rating | Rank | Disability Age Over 75 |
| Mexican American Indians | 0.0 /100 | #296 | Tragic 50.0% |
| Armenians | 0.0 /100 | #297 | Tragic 50.0% |
| Marshallese | 0.0 /100 | #298 | Tragic 50.1% |
| Immigrants | Micronesia | 0.0 /100 | #299 | Tragic 50.1% |
| Cape Verdeans | 0.0 /100 | #300 | Tragic 50.1% |
| Dominicans | 0.0 /100 | #301 | Tragic 50.2% |
| Cherokee | 0.0 /100 | #302 | Tragic 50.2% |
| Japanese | 0.0 /100 | #303 | Tragic 50.2% |
| Immigrants | Dominican Republic | 0.0 /100 | #304 | Tragic 50.3% |
| Central American Indians | 0.0 /100 | #305 | Tragic 50.5% |
| Immigrants | Central America | 0.0 /100 | #306 | Tragic 50.5% |
| Immigrants | Fiji | 0.0 /100 | #307 | Tragic 50.6% |
| Hispanics or Latinos | 0.0 /100 | #308 | Tragic 50.6% |
| Aleuts | 0.0 /100 | #309 | Tragic 50.6% |
| Tlingit-Haida | 0.0 /100 | #310 | Tragic 50.6% |
| Cajuns | 0.0 /100 | #311 | Tragic 50.7% |
| Cheyenne | 0.0 /100 | #312 | Tragic 50.9% |
| Immigrants | Azores | 0.0 /100 | #313 | Tragic 50.9% |
| Immigrants | Mexico | 0.0 /100 | #314 | Tragic 51.1% |
| Mexicans | 0.0 /100 | #315 | Tragic 51.1% |
| Chickasaw | 0.0 /100 | #316 | Tragic 51.2% |