Immigrants from Venezuela vs Mexican Male Unemployment
COMPARE
Immigrants from Venezuela
Mexican
Male Unemployment
Male Unemployment Comparison
Immigrants from Venezuela
Mexicans
4.4%
MALE UNEMPLOYMENT
100.0/ 100
METRIC RATING
4th/ 347
METRIC RANK
5.8%
MALE UNEMPLOYMENT
0.2/ 100
METRIC RATING
252nd/ 347
METRIC RANK
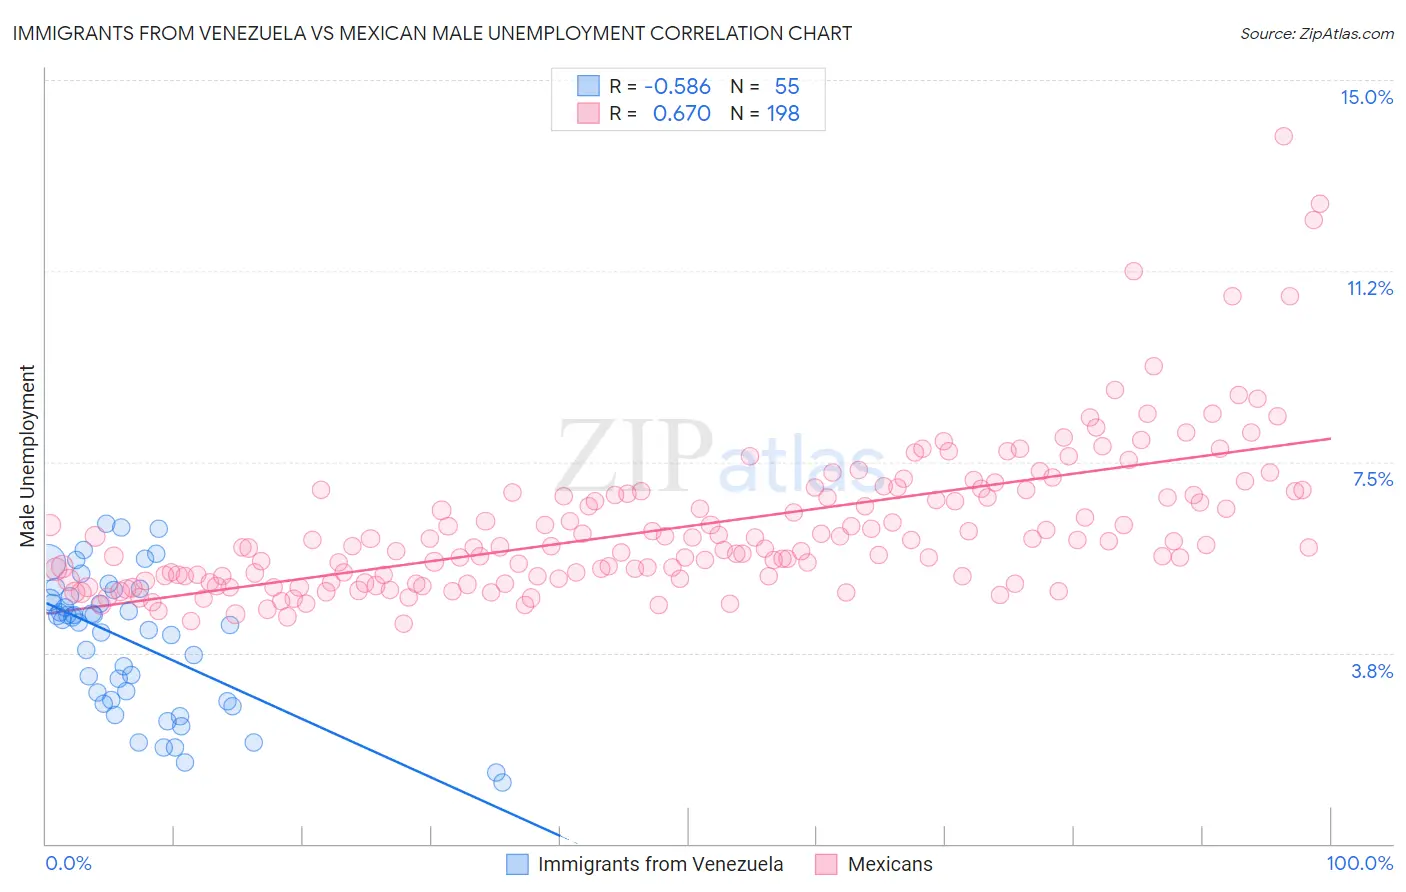
Immigrants from Venezuela vs Mexican Male Unemployment Correlation Chart
The statistical analysis conducted on geographies consisting of 287,397,885 people shows a substantial negative correlation between the proportion of Immigrants from Venezuela and unemployment rate among males in the United States with a correlation coefficient (R) of -0.586 and weighted average of 4.4%. Similarly, the statistical analysis conducted on geographies consisting of 555,694,917 people shows a significant positive correlation between the proportion of Mexicans and unemployment rate among males in the United States with a correlation coefficient (R) of 0.670 and weighted average of 5.8%, a difference of 29.6%.
Male Unemployment Correlation Summary
| Measurement | Immigrants from Venezuela | Mexican |
| Minimum | 1.2% | 4.3% |
| Maximum | 6.3% | 13.9% |
| Range | 5.1% | 9.6% |
| Mean | 3.9% | 6.2% |
| Median | 4.3% | 5.8% |
| Interquartile 25% (IQ1) | 2.8% | 5.2% |
| Interquartile 75% (IQ3) | 4.9% | 6.9% |
| Interquartile Range (IQR) | 2.1% | 1.7% |
| Standard Deviation (Sample) | 1.3% | 1.5% |
| Standard Deviation (Population) | 1.3% | 1.5% |
Similar Demographics by Male Unemployment
Demographics Similar to Immigrants from Venezuela by Male Unemployment
In terms of male unemployment, the demographic groups most similar to Immigrants from Venezuela are Norwegian (4.4%, a difference of 0.33%), Immigrants from Cuba (4.4%, a difference of 0.58%), Danish (4.5%, a difference of 1.0%), Venezuelan (4.5%, a difference of 1.5%), and Immigrants from India (4.4%, a difference of 1.7%).
| Demographics | Rating | Rank | Male Unemployment |
| Immigrants | India | 100.0 /100 | #1 | Exceptional 4.4% |
| Immigrants | Cuba | 100.0 /100 | #2 | Exceptional 4.4% |
| Norwegians | 100.0 /100 | #3 | Exceptional 4.4% |
| Immigrants | Venezuela | 100.0 /100 | #4 | Exceptional 4.4% |
| Danes | 100.0 /100 | #5 | Exceptional 4.5% |
| Venezuelans | 100.0 /100 | #6 | Exceptional 4.5% |
| Czechs | 100.0 /100 | #7 | Exceptional 4.5% |
| Luxembourgers | 100.0 /100 | #8 | Exceptional 4.5% |
| Thais | 100.0 /100 | #9 | Exceptional 4.6% |
| Cubans | 100.0 /100 | #10 | Exceptional 4.6% |
| Swedes | 100.0 /100 | #11 | Exceptional 4.6% |
| Immigrants | Bolivia | 100.0 /100 | #12 | Exceptional 4.7% |
| Bolivians | 100.0 /100 | #13 | Exceptional 4.7% |
| Germans | 100.0 /100 | #14 | Exceptional 4.7% |
| Scandinavians | 100.0 /100 | #15 | Exceptional 4.7% |
Demographics Similar to Mexicans by Male Unemployment
In terms of male unemployment, the demographic groups most similar to Mexicans are Mexican American Indian (5.8%, a difference of 0.13%), Japanese (5.8%, a difference of 0.30%), Kiowa (5.8%, a difference of 0.41%), Comanche (5.8%, a difference of 0.49%), and Spanish American (5.7%, a difference of 0.57%).
| Demographics | Rating | Rank | Male Unemployment |
| Yaqui | 0.7 /100 | #245 | Tragic 5.7% |
| Iroquois | 0.6 /100 | #246 | Tragic 5.7% |
| Hawaiians | 0.6 /100 | #247 | Tragic 5.7% |
| Marshallese | 0.5 /100 | #248 | Tragic 5.7% |
| Cree | 0.4 /100 | #249 | Tragic 5.7% |
| Immigrants | Bahamas | 0.4 /100 | #250 | Tragic 5.7% |
| Spanish Americans | 0.3 /100 | #251 | Tragic 5.7% |
| Mexicans | 0.2 /100 | #252 | Tragic 5.8% |
| Mexican American Indians | 0.2 /100 | #253 | Tragic 5.8% |
| Japanese | 0.2 /100 | #254 | Tragic 5.8% |
| Kiowa | 0.2 /100 | #255 | Tragic 5.8% |
| Comanche | 0.2 /100 | #256 | Tragic 5.8% |
| Hispanics or Latinos | 0.1 /100 | #257 | Tragic 5.8% |
| Dutch West Indians | 0.1 /100 | #258 | Tragic 5.8% |
| Cajuns | 0.1 /100 | #259 | Tragic 5.8% |