Immigrants from Austria vs Immigrants from Yemen Unemployment
COMPARE
Immigrants from Austria
Immigrants from Yemen
Unemployment
Unemployment Comparison
Immigrants from Austria
Immigrants from Yemen
5.0%
UNEMPLOYMENT
95.9/ 100
METRIC RATING
94th/ 347
METRIC RANK
7.7%
UNEMPLOYMENT
0.0/ 100
METRIC RATING
336th/ 347
METRIC RANK
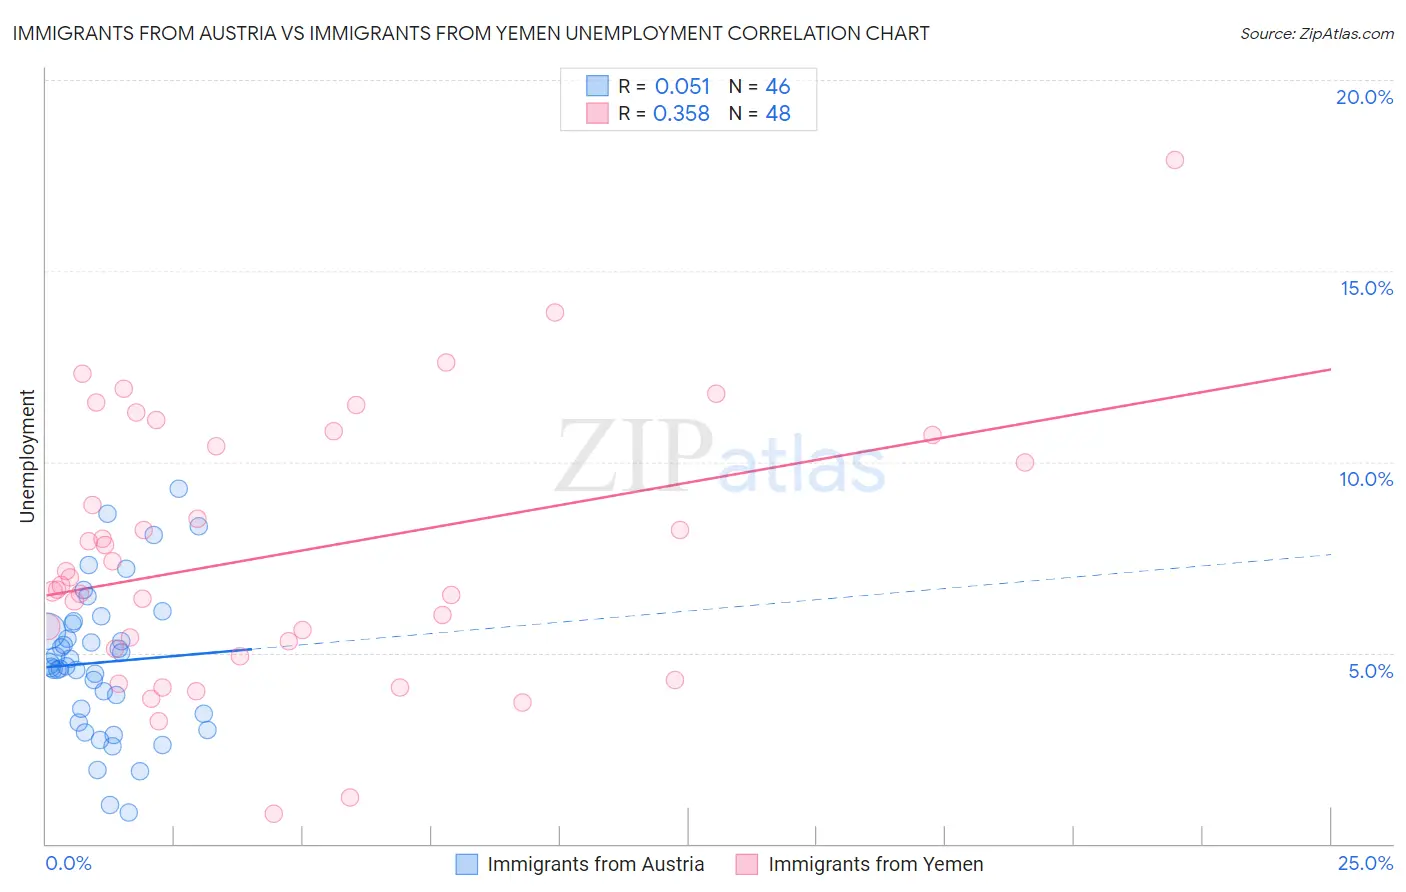
Immigrants from Austria vs Immigrants from Yemen Unemployment Correlation Chart
The statistical analysis conducted on geographies consisting of 167,916,125 people shows a slight positive correlation between the proportion of Immigrants from Austria and unemployment in the United States with a correlation coefficient (R) of 0.051 and weighted average of 5.0%. Similarly, the statistical analysis conducted on geographies consisting of 82,429,488 people shows a mild positive correlation between the proportion of Immigrants from Yemen and unemployment in the United States with a correlation coefficient (R) of 0.358 and weighted average of 7.7%, a difference of 54.1%.
Unemployment Correlation Summary
| Measurement | Immigrants from Austria | Immigrants from Yemen |
| Minimum | 0.82% | 0.80% |
| Maximum | 9.3% | 17.9% |
| Range | 8.5% | 17.1% |
| Mean | 4.8% | 7.6% |
| Median | 4.7% | 6.9% |
| Interquartile 25% (IQ1) | 3.4% | 5.2% |
| Interquartile 75% (IQ3) | 5.8% | 10.6% |
| Interquartile Range (IQR) | 2.4% | 5.4% |
| Standard Deviation (Sample) | 1.9% | 3.5% |
| Standard Deviation (Population) | 1.9% | 3.4% |
Similar Demographics by Unemployment
Demographics Similar to Immigrants from Austria by Unemployment
In terms of unemployment, the demographic groups most similar to Immigrants from Austria are Ukrainian (5.0%, a difference of 0.030%), Immigrants from South Africa (5.0%, a difference of 0.12%), Immigrants from Serbia (5.0%, a difference of 0.13%), Immigrants from Sudan (5.0%, a difference of 0.14%), and Immigrants from North Macedonia (5.0%, a difference of 0.16%).
| Demographics | Rating | Rank | Unemployment |
| Immigrants | Moldova | 96.6 /100 | #87 | Exceptional 5.0% |
| Immigrants | Korea | 96.6 /100 | #88 | Exceptional 5.0% |
| Jordanians | 96.4 /100 | #89 | Exceptional 5.0% |
| Immigrants | North Macedonia | 96.3 /100 | #90 | Exceptional 5.0% |
| Immigrants | Sudan | 96.3 /100 | #91 | Exceptional 5.0% |
| Immigrants | South Africa | 96.2 /100 | #92 | Exceptional 5.0% |
| Ukrainians | 96.0 /100 | #93 | Exceptional 5.0% |
| Immigrants | Austria | 95.9 /100 | #94 | Exceptional 5.0% |
| Immigrants | Serbia | 95.6 /100 | #95 | Exceptional 5.0% |
| Immigrants | England | 95.2 /100 | #96 | Exceptional 5.0% |
| Immigrants | Czechoslovakia | 95.1 /100 | #97 | Exceptional 5.0% |
| Romanians | 95.0 /100 | #98 | Exceptional 5.0% |
| Mongolians | 94.8 /100 | #99 | Exceptional 5.0% |
| Estonians | 94.6 /100 | #100 | Exceptional 5.0% |
| Americans | 94.3 /100 | #101 | Exceptional 5.0% |
Demographics Similar to Immigrants from Yemen by Unemployment
In terms of unemployment, the demographic groups most similar to Immigrants from Yemen are Alaskan Athabascan (7.7%, a difference of 0.72%), Apache (7.4%, a difference of 3.8%), Cheyenne (8.0%, a difference of 3.8%), Immigrants from Dominican Republic (7.4%, a difference of 4.3%), and Sioux (7.4%, a difference of 4.3%).
| Demographics | Rating | Rank | Unemployment |
| Alaska Natives | 0.0 /100 | #329 | Tragic 7.2% |
| Yakama | 0.0 /100 | #330 | Tragic 7.3% |
| Dominicans | 0.0 /100 | #331 | Tragic 7.4% |
| Sioux | 0.0 /100 | #332 | Tragic 7.4% |
| Immigrants | Dominican Republic | 0.0 /100 | #333 | Tragic 7.4% |
| Apache | 0.0 /100 | #334 | Tragic 7.4% |
| Alaskan Athabascans | 0.0 /100 | #335 | Tragic 7.7% |
| Immigrants | Yemen | 0.0 /100 | #336 | Tragic 7.7% |
| Cheyenne | 0.0 /100 | #337 | Tragic 8.0% |
| Pima | 0.0 /100 | #338 | Tragic 8.2% |
| Navajo | 0.0 /100 | #339 | Tragic 8.4% |
| Puerto Ricans | 0.0 /100 | #340 | Tragic 8.4% |
| Tohono O'odham | 0.0 /100 | #341 | Tragic 8.9% |
| Hopi | 0.0 /100 | #342 | Tragic 8.9% |
| Yuman | 0.0 /100 | #343 | Tragic 9.1% |