Apache vs Immigrants from Cambodia Female Unemployment
COMPARE
Apache
Immigrants from Cambodia
Female Unemployment
Female Unemployment Comparison
Apache
Immigrants from Cambodia
6.6%
FEMALE UNEMPLOYMENT
0.0/ 100
METRIC RATING
325th/ 347
METRIC RANK
5.5%
FEMALE UNEMPLOYMENT
3.3/ 100
METRIC RATING
236th/ 347
METRIC RANK
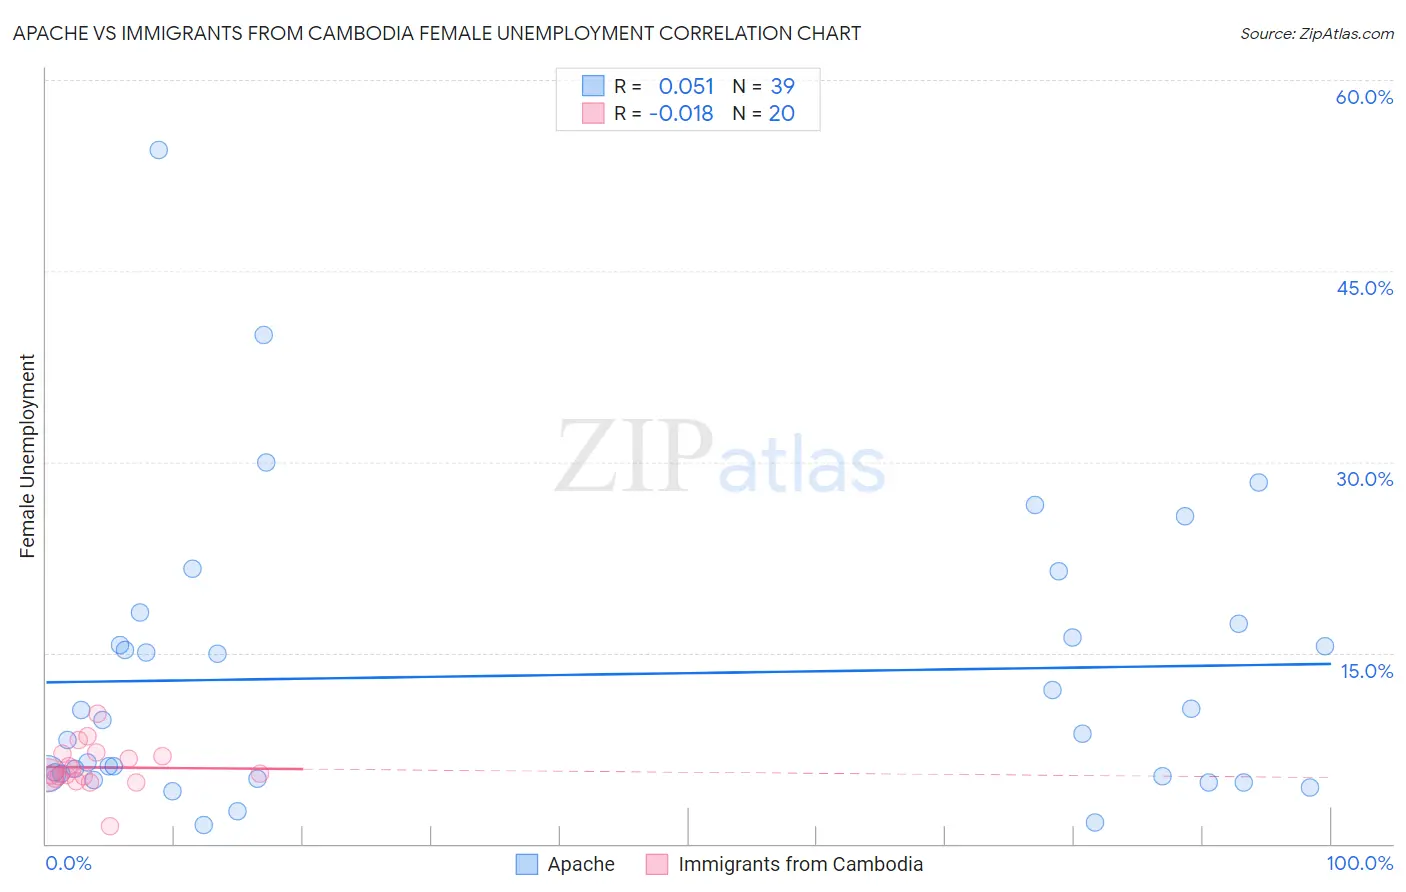
Apache vs Immigrants from Cambodia Female Unemployment Correlation Chart
The statistical analysis conducted on geographies consisting of 230,279,610 people shows a slight positive correlation between the proportion of Apache and unemploymnet rate among females in the United States with a correlation coefficient (R) of 0.051 and weighted average of 6.6%. Similarly, the statistical analysis conducted on geographies consisting of 204,858,353 people shows no correlation between the proportion of Immigrants from Cambodia and unemploymnet rate among females in the United States with a correlation coefficient (R) of -0.018 and weighted average of 5.5%, a difference of 19.3%.
Female Unemployment Correlation Summary
| Measurement | Apache | Immigrants from Cambodia |
| Minimum | 1.5% | 1.4% |
| Maximum | 54.5% | 10.2% |
| Range | 53.0% | 8.8% |
| Mean | 13.2% | 6.0% |
| Median | 9.7% | 5.5% |
| Interquartile 25% (IQ1) | 5.3% | 5.2% |
| Interquartile 75% (IQ3) | 17.3% | 7.0% |
| Interquartile Range (IQR) | 12.0% | 1.8% |
| Standard Deviation (Sample) | 11.3% | 1.8% |
| Standard Deviation (Population) | 11.1% | 1.7% |
Similar Demographics by Female Unemployment
Demographics Similar to Apache by Female Unemployment
In terms of female unemployment, the demographic groups most similar to Apache are Cheyenne (6.6%, a difference of 0.27%), Native/Alaskan (6.6%, a difference of 0.56%), Alaska Native (6.6%, a difference of 0.64%), Guyanese (6.7%, a difference of 1.1%), and Immigrants from Belize (6.5%, a difference of 1.3%).
| Demographics | Rating | Rank | Female Unemployment |
| British West Indians | 0.0 /100 | #318 | Tragic 6.4% |
| Immigrants | Bangladesh | 0.0 /100 | #319 | Tragic 6.5% |
| Immigrants | Dominica | 0.0 /100 | #320 | Tragic 6.5% |
| Blacks/African Americans | 0.0 /100 | #321 | Tragic 6.5% |
| Vietnamese | 0.0 /100 | #322 | Tragic 6.5% |
| Immigrants | Belize | 0.0 /100 | #323 | Tragic 6.5% |
| Cheyenne | 0.0 /100 | #324 | Tragic 6.6% |
| Apache | 0.0 /100 | #325 | Tragic 6.6% |
| Natives/Alaskans | 0.0 /100 | #326 | Tragic 6.6% |
| Alaska Natives | 0.0 /100 | #327 | Tragic 6.6% |
| Guyanese | 0.0 /100 | #328 | Tragic 6.7% |
| Immigrants | Guyana | 0.0 /100 | #329 | Tragic 6.7% |
| Yakama | 0.0 /100 | #330 | Tragic 6.7% |
| Paiute | 0.0 /100 | #331 | Tragic 6.8% |
| Sioux | 0.0 /100 | #332 | Tragic 7.0% |
Demographics Similar to Immigrants from Cambodia by Female Unemployment
In terms of female unemployment, the demographic groups most similar to Immigrants from Cambodia are Immigrants from Panama (5.5%, a difference of 0.020%), Immigrants from Iran (5.5%, a difference of 0.030%), Immigrants from Lebanon (5.5%, a difference of 0.040%), Sierra Leonean (5.5%, a difference of 0.040%), and Moroccan (5.5%, a difference of 0.060%).
| Demographics | Rating | Rank | Female Unemployment |
| Panamanians | 4.7 /100 | #229 | Tragic 5.5% |
| Immigrants | Uruguay | 4.7 /100 | #230 | Tragic 5.5% |
| Immigrants | Iraq | 3.9 /100 | #231 | Tragic 5.5% |
| Liberians | 3.9 /100 | #232 | Tragic 5.5% |
| Moroccans | 3.4 /100 | #233 | Tragic 5.5% |
| Immigrants | Lebanon | 3.3 /100 | #234 | Tragic 5.5% |
| Immigrants | Iran | 3.3 /100 | #235 | Tragic 5.5% |
| Immigrants | Cambodia | 3.3 /100 | #236 | Tragic 5.5% |
| Immigrants | Panama | 3.2 /100 | #237 | Tragic 5.5% |
| Sierra Leoneans | 3.2 /100 | #238 | Tragic 5.5% |
| Aleuts | 3.0 /100 | #239 | Tragic 5.5% |
| Immigrants | South America | 2.9 /100 | #240 | Tragic 5.5% |
| South American Indians | 2.8 /100 | #241 | Tragic 5.5% |
| Marshallese | 2.3 /100 | #242 | Tragic 5.6% |
| Spanish Americans | 2.2 /100 | #243 | Tragic 5.6% |