Apache vs Immigrants from France Female Unemployment
COMPARE
Apache
Immigrants from France
Female Unemployment
Female Unemployment Comparison
Apache
Immigrants from France
6.6%
FEMALE UNEMPLOYMENT
0.0/ 100
METRIC RATING
325th/ 347
METRIC RANK
5.1%
FEMALE UNEMPLOYMENT
82.7/ 100
METRIC RATING
140th/ 347
METRIC RANK
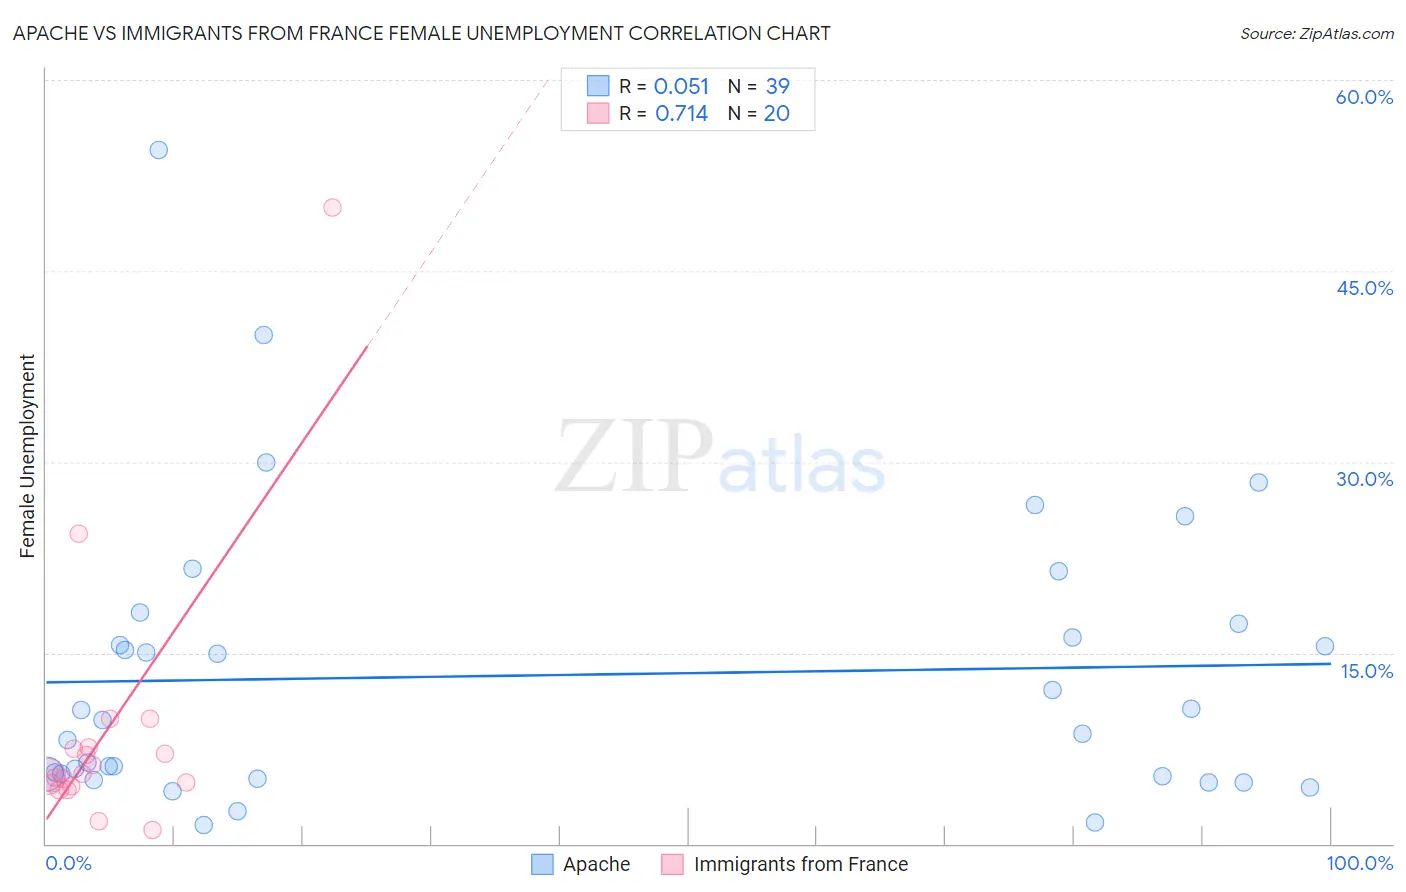
Apache vs Immigrants from France Female Unemployment Correlation Chart
The statistical analysis conducted on geographies consisting of 230,279,610 people shows a slight positive correlation between the proportion of Apache and unemploymnet rate among females in the United States with a correlation coefficient (R) of 0.051 and weighted average of 6.6%. Similarly, the statistical analysis conducted on geographies consisting of 287,167,055 people shows a strong positive correlation between the proportion of Immigrants from France and unemploymnet rate among females in the United States with a correlation coefficient (R) of 0.714 and weighted average of 5.1%, a difference of 28.3%.
Female Unemployment Correlation Summary
| Measurement | Apache | Immigrants from France |
| Minimum | 1.5% | 1.1% |
| Maximum | 54.5% | 50.0% |
| Range | 53.0% | 48.9% |
| Mean | 13.2% | 8.8% |
| Median | 9.7% | 5.4% |
| Interquartile 25% (IQ1) | 5.3% | 4.6% |
| Interquartile 75% (IQ3) | 17.3% | 7.5% |
| Interquartile Range (IQR) | 12.0% | 2.9% |
| Standard Deviation (Sample) | 11.3% | 10.8% |
| Standard Deviation (Population) | 11.1% | 10.5% |
Similar Demographics by Female Unemployment
Demographics Similar to Apache by Female Unemployment
In terms of female unemployment, the demographic groups most similar to Apache are Cheyenne (6.6%, a difference of 0.27%), Native/Alaskan (6.6%, a difference of 0.56%), Alaska Native (6.6%, a difference of 0.64%), Guyanese (6.7%, a difference of 1.1%), and Immigrants from Belize (6.5%, a difference of 1.3%).
| Demographics | Rating | Rank | Female Unemployment |
| British West Indians | 0.0 /100 | #318 | Tragic 6.4% |
| Immigrants | Bangladesh | 0.0 /100 | #319 | Tragic 6.5% |
| Immigrants | Dominica | 0.0 /100 | #320 | Tragic 6.5% |
| Blacks/African Americans | 0.0 /100 | #321 | Tragic 6.5% |
| Vietnamese | 0.0 /100 | #322 | Tragic 6.5% |
| Immigrants | Belize | 0.0 /100 | #323 | Tragic 6.5% |
| Cheyenne | 0.0 /100 | #324 | Tragic 6.6% |
| Apache | 0.0 /100 | #325 | Tragic 6.6% |
| Natives/Alaskans | 0.0 /100 | #326 | Tragic 6.6% |
| Alaska Natives | 0.0 /100 | #327 | Tragic 6.6% |
| Guyanese | 0.0 /100 | #328 | Tragic 6.7% |
| Immigrants | Guyana | 0.0 /100 | #329 | Tragic 6.7% |
| Yakama | 0.0 /100 | #330 | Tragic 6.7% |
| Paiute | 0.0 /100 | #331 | Tragic 6.8% |
| Sioux | 0.0 /100 | #332 | Tragic 7.0% |
Demographics Similar to Immigrants from France by Female Unemployment
In terms of female unemployment, the demographic groups most similar to Immigrants from France are Immigrants from Eastern Asia (5.1%, a difference of 0.040%), Chickasaw (5.1%, a difference of 0.060%), Immigrants from Eastern Europe (5.1%, a difference of 0.12%), Pakistani (5.1%, a difference of 0.13%), and Indian (Asian) (5.1%, a difference of 0.17%).
| Demographics | Rating | Rank | Female Unemployment |
| Immigrants | Hong Kong | 84.8 /100 | #133 | Excellent 5.1% |
| Immigrants | Eritrea | 84.6 /100 | #134 | Excellent 5.1% |
| Immigrants | Latvia | 84.6 /100 | #135 | Excellent 5.1% |
| Indians (Asian) | 84.2 /100 | #136 | Excellent 5.1% |
| Pakistanis | 83.8 /100 | #137 | Excellent 5.1% |
| Chickasaw | 83.2 /100 | #138 | Excellent 5.1% |
| Immigrants | Eastern Asia | 83.0 /100 | #139 | Excellent 5.1% |
| Immigrants | France | 82.7 /100 | #140 | Excellent 5.1% |
| Immigrants | Eastern Europe | 81.5 /100 | #141 | Excellent 5.1% |
| Palestinians | 80.8 /100 | #142 | Excellent 5.1% |
| Immigrants | Kazakhstan | 80.7 /100 | #143 | Excellent 5.1% |
| Immigrants | Jordan | 80.4 /100 | #144 | Excellent 5.1% |
| Immigrants | Oceania | 79.5 /100 | #145 | Good 5.2% |
| Immigrants | Norway | 79.4 /100 | #146 | Good 5.2% |
| Argentineans | 79.2 /100 | #147 | Good 5.2% |