Apache vs Colombian Female Unemployment
COMPARE
Apache
Colombian
Female Unemployment
Female Unemployment Comparison
Apache
Colombians
6.6%
FEMALE UNEMPLOYMENT
0.0/ 100
METRIC RATING
325th/ 347
METRIC RANK
5.3%
FEMALE UNEMPLOYMENT
27.0/ 100
METRIC RATING
194th/ 347
METRIC RANK
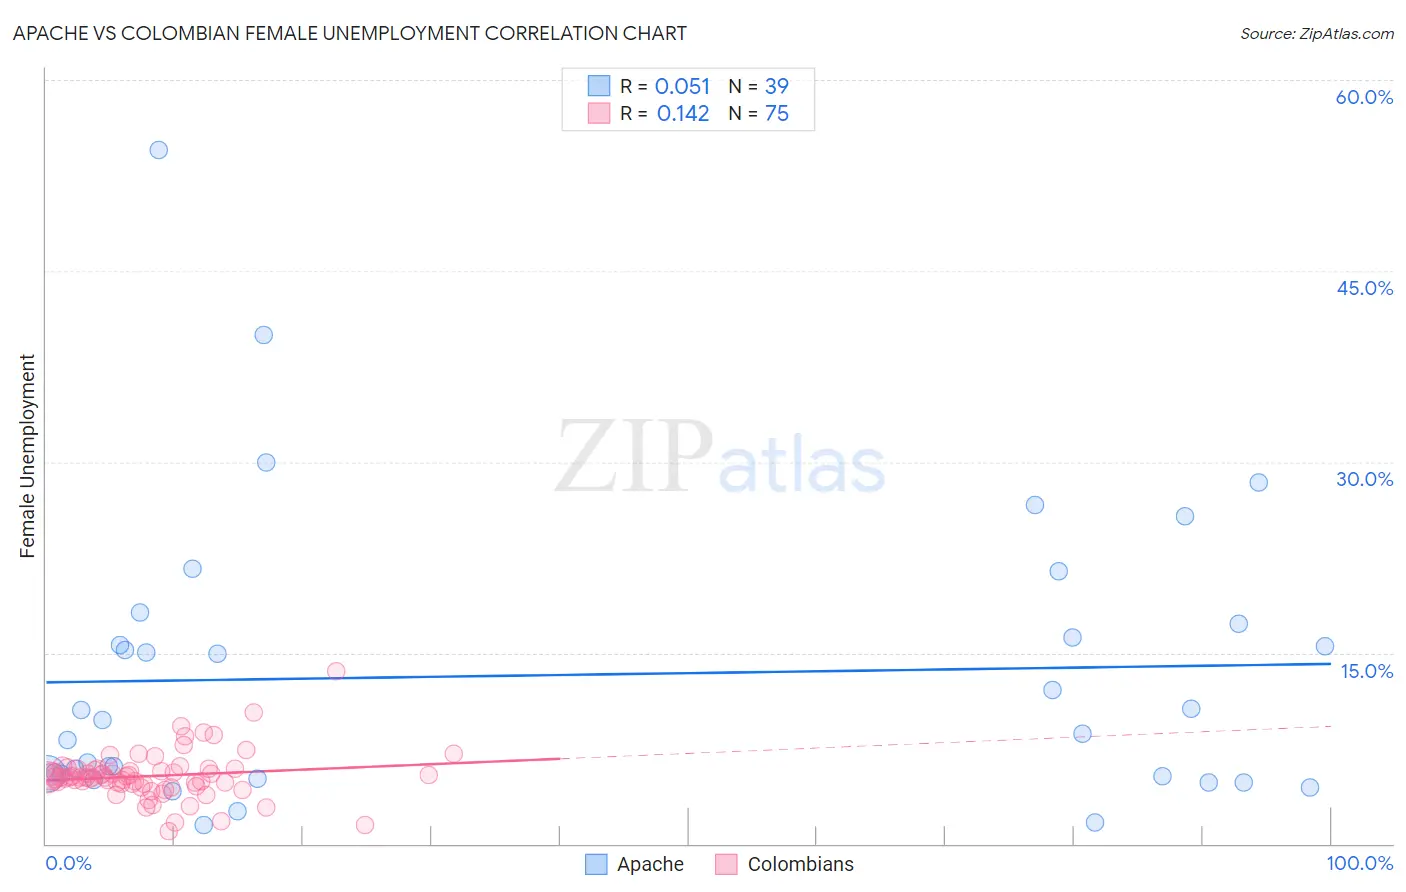
Apache vs Colombian Female Unemployment Correlation Chart
The statistical analysis conducted on geographies consisting of 230,279,610 people shows a slight positive correlation between the proportion of Apache and unemploymnet rate among females in the United States with a correlation coefficient (R) of 0.051 and weighted average of 6.6%. Similarly, the statistical analysis conducted on geographies consisting of 417,884,400 people shows a poor positive correlation between the proportion of Colombians and unemploymnet rate among females in the United States with a correlation coefficient (R) of 0.142 and weighted average of 5.3%, a difference of 23.5%.
Female Unemployment Correlation Summary
| Measurement | Apache | Colombian |
| Minimum | 1.5% | 1.0% |
| Maximum | 54.5% | 13.6% |
| Range | 53.0% | 12.6% |
| Mean | 13.2% | 5.3% |
| Median | 9.7% | 5.2% |
| Interquartile 25% (IQ1) | 5.3% | 4.7% |
| Interquartile 75% (IQ3) | 17.3% | 5.8% |
| Interquartile Range (IQR) | 12.0% | 1.2% |
| Standard Deviation (Sample) | 11.3% | 1.9% |
| Standard Deviation (Population) | 11.1% | 1.9% |
Similar Demographics by Female Unemployment
Demographics Similar to Apache by Female Unemployment
In terms of female unemployment, the demographic groups most similar to Apache are Cheyenne (6.6%, a difference of 0.27%), Native/Alaskan (6.6%, a difference of 0.56%), Alaska Native (6.6%, a difference of 0.64%), Guyanese (6.7%, a difference of 1.1%), and Immigrants from Belize (6.5%, a difference of 1.3%).
| Demographics | Rating | Rank | Female Unemployment |
| British West Indians | 0.0 /100 | #318 | Tragic 6.4% |
| Immigrants | Bangladesh | 0.0 /100 | #319 | Tragic 6.5% |
| Immigrants | Dominica | 0.0 /100 | #320 | Tragic 6.5% |
| Blacks/African Americans | 0.0 /100 | #321 | Tragic 6.5% |
| Vietnamese | 0.0 /100 | #322 | Tragic 6.5% |
| Immigrants | Belize | 0.0 /100 | #323 | Tragic 6.5% |
| Cheyenne | 0.0 /100 | #324 | Tragic 6.6% |
| Apache | 0.0 /100 | #325 | Tragic 6.6% |
| Natives/Alaskans | 0.0 /100 | #326 | Tragic 6.6% |
| Alaska Natives | 0.0 /100 | #327 | Tragic 6.6% |
| Guyanese | 0.0 /100 | #328 | Tragic 6.7% |
| Immigrants | Guyana | 0.0 /100 | #329 | Tragic 6.7% |
| Yakama | 0.0 /100 | #330 | Tragic 6.7% |
| Paiute | 0.0 /100 | #331 | Tragic 6.8% |
| Sioux | 0.0 /100 | #332 | Tragic 7.0% |
Demographics Similar to Colombians by Female Unemployment
In terms of female unemployment, the demographic groups most similar to Colombians are Arab (5.3%, a difference of 0.050%), Immigrants from Colombia (5.3%, a difference of 0.060%), Portuguese (5.3%, a difference of 0.12%), Spaniard (5.3%, a difference of 0.14%), and Alsatian (5.3%, a difference of 0.24%).
| Demographics | Rating | Rank | Female Unemployment |
| Immigrants | Albania | 35.4 /100 | #187 | Fair 5.3% |
| Afghans | 33.9 /100 | #188 | Fair 5.3% |
| Costa Ricans | 33.8 /100 | #189 | Fair 5.3% |
| Ugandans | 31.2 /100 | #190 | Fair 5.3% |
| Cherokee | 30.8 /100 | #191 | Fair 5.3% |
| Portuguese | 28.6 /100 | #192 | Fair 5.3% |
| Arabs | 27.7 /100 | #193 | Fair 5.3% |
| Colombians | 27.0 /100 | #194 | Fair 5.3% |
| Immigrants | Colombia | 26.2 /100 | #195 | Fair 5.3% |
| Spaniards | 25.2 /100 | #196 | Fair 5.3% |
| Alsatians | 23.9 /100 | #197 | Fair 5.3% |
| Tsimshian | 23.1 /100 | #198 | Fair 5.4% |
| Hawaiians | 22.2 /100 | #199 | Fair 5.4% |
| Soviet Union | 21.7 /100 | #200 | Fair 5.4% |
| Immigrants | Middle Africa | 20.8 /100 | #201 | Fair 5.4% |