Yaqui vs Immigrants from France Female Unemployment
COMPARE
Yaqui
Immigrants from France
Female Unemployment
Female Unemployment Comparison
Yaqui
Immigrants from France
6.0%
FEMALE UNEMPLOYMENT
0.0/ 100
METRIC RATING
278th/ 347
METRIC RANK
5.1%
FEMALE UNEMPLOYMENT
82.7/ 100
METRIC RATING
140th/ 347
METRIC RANK
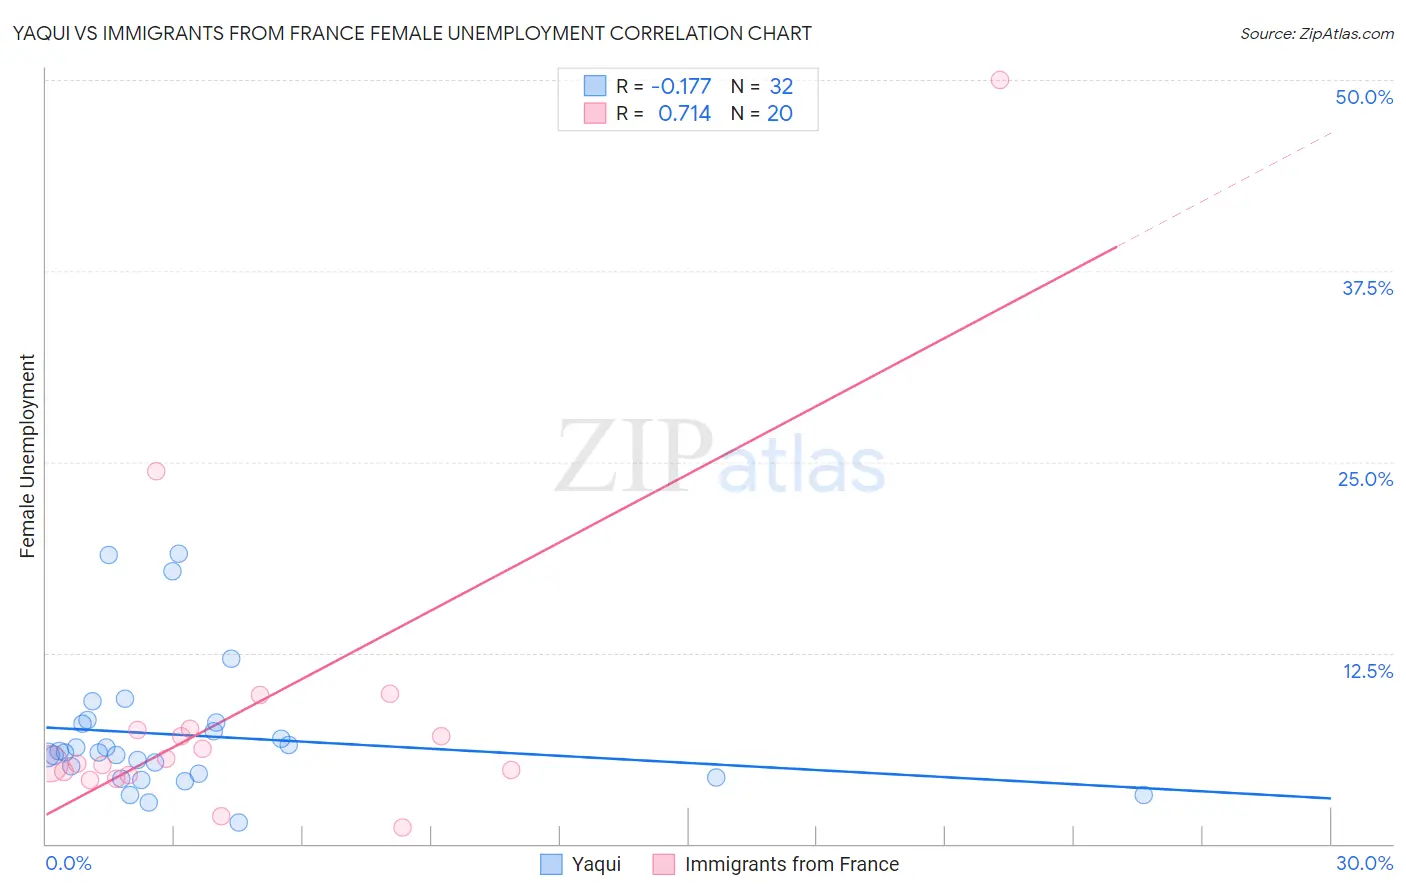
Yaqui vs Immigrants from France Female Unemployment Correlation Chart
The statistical analysis conducted on geographies consisting of 107,534,058 people shows a poor negative correlation between the proportion of Yaqui and unemploymnet rate among females in the United States with a correlation coefficient (R) of -0.177 and weighted average of 6.0%. Similarly, the statistical analysis conducted on geographies consisting of 287,167,055 people shows a strong positive correlation between the proportion of Immigrants from France and unemploymnet rate among females in the United States with a correlation coefficient (R) of 0.714 and weighted average of 5.1%, a difference of 17.0%.
Female Unemployment Correlation Summary
| Measurement | Yaqui | Immigrants from France |
| Minimum | 1.4% | 1.1% |
| Maximum | 19.0% | 50.0% |
| Range | 17.6% | 48.9% |
| Mean | 7.1% | 8.8% |
| Median | 5.9% | 5.4% |
| Interquartile 25% (IQ1) | 4.5% | 4.6% |
| Interquartile 75% (IQ3) | 7.9% | 7.5% |
| Interquartile Range (IQR) | 3.4% | 2.9% |
| Standard Deviation (Sample) | 4.3% | 10.8% |
| Standard Deviation (Population) | 4.2% | 10.5% |
Similar Demographics by Female Unemployment
Demographics Similar to Yaqui by Female Unemployment
In terms of female unemployment, the demographic groups most similar to Yaqui are Immigrants from Ghana (6.0%, a difference of 0.0%), Armenian (6.0%, a difference of 0.11%), Mexican American Indian (6.0%, a difference of 0.17%), Guatemalan (6.0%, a difference of 0.21%), and Bahamian (6.0%, a difference of 0.40%).
| Demographics | Rating | Rank | Female Unemployment |
| Central Americans | 0.0 /100 | #271 | Tragic 5.9% |
| Lumbee | 0.0 /100 | #272 | Tragic 5.9% |
| Ghanaians | 0.0 /100 | #273 | Tragic 5.9% |
| Africans | 0.0 /100 | #274 | Tragic 5.9% |
| Senegalese | 0.0 /100 | #275 | Tragic 6.0% |
| Bahamians | 0.0 /100 | #276 | Tragic 6.0% |
| Immigrants | Ghana | 0.0 /100 | #277 | Tragic 6.0% |
| Yaqui | 0.0 /100 | #278 | Tragic 6.0% |
| Armenians | 0.0 /100 | #279 | Tragic 6.0% |
| Mexican American Indians | 0.0 /100 | #280 | Tragic 6.0% |
| Guatemalans | 0.0 /100 | #281 | Tragic 6.0% |
| Colville | 0.0 /100 | #282 | Tragic 6.0% |
| Salvadorans | 0.0 /100 | #283 | Tragic 6.0% |
| Immigrants | Senegal | 0.0 /100 | #284 | Tragic 6.1% |
| Immigrants | Cabo Verde | 0.0 /100 | #285 | Tragic 6.1% |
Demographics Similar to Immigrants from France by Female Unemployment
In terms of female unemployment, the demographic groups most similar to Immigrants from France are Immigrants from Eastern Asia (5.1%, a difference of 0.040%), Chickasaw (5.1%, a difference of 0.060%), Immigrants from Eastern Europe (5.1%, a difference of 0.12%), Pakistani (5.1%, a difference of 0.13%), and Indian (Asian) (5.1%, a difference of 0.17%).
| Demographics | Rating | Rank | Female Unemployment |
| Immigrants | Hong Kong | 84.8 /100 | #133 | Excellent 5.1% |
| Immigrants | Eritrea | 84.6 /100 | #134 | Excellent 5.1% |
| Immigrants | Latvia | 84.6 /100 | #135 | Excellent 5.1% |
| Indians (Asian) | 84.2 /100 | #136 | Excellent 5.1% |
| Pakistanis | 83.8 /100 | #137 | Excellent 5.1% |
| Chickasaw | 83.2 /100 | #138 | Excellent 5.1% |
| Immigrants | Eastern Asia | 83.0 /100 | #139 | Excellent 5.1% |
| Immigrants | France | 82.7 /100 | #140 | Excellent 5.1% |
| Immigrants | Eastern Europe | 81.5 /100 | #141 | Excellent 5.1% |
| Palestinians | 80.8 /100 | #142 | Excellent 5.1% |
| Immigrants | Kazakhstan | 80.7 /100 | #143 | Excellent 5.1% |
| Immigrants | Jordan | 80.4 /100 | #144 | Excellent 5.1% |
| Immigrants | Oceania | 79.5 /100 | #145 | Good 5.2% |
| Immigrants | Norway | 79.4 /100 | #146 | Good 5.2% |
| Argentineans | 79.2 /100 | #147 | Good 5.2% |