Apache vs Immigrants from France In Labor Force | Age 30-34
COMPARE
Apache
Immigrants from France
In Labor Force | Age 30-34
In Labor Force | Age 30-34 Comparison
Apache
Immigrants from France
79.0%
IN LABOR FORCE | AGE 30-34
0.0/ 100
METRIC RATING
339th/ 347
METRIC RANK
85.5%
IN LABOR FORCE | AGE 30-34
99.5/ 100
METRIC RATING
60th/ 347
METRIC RANK
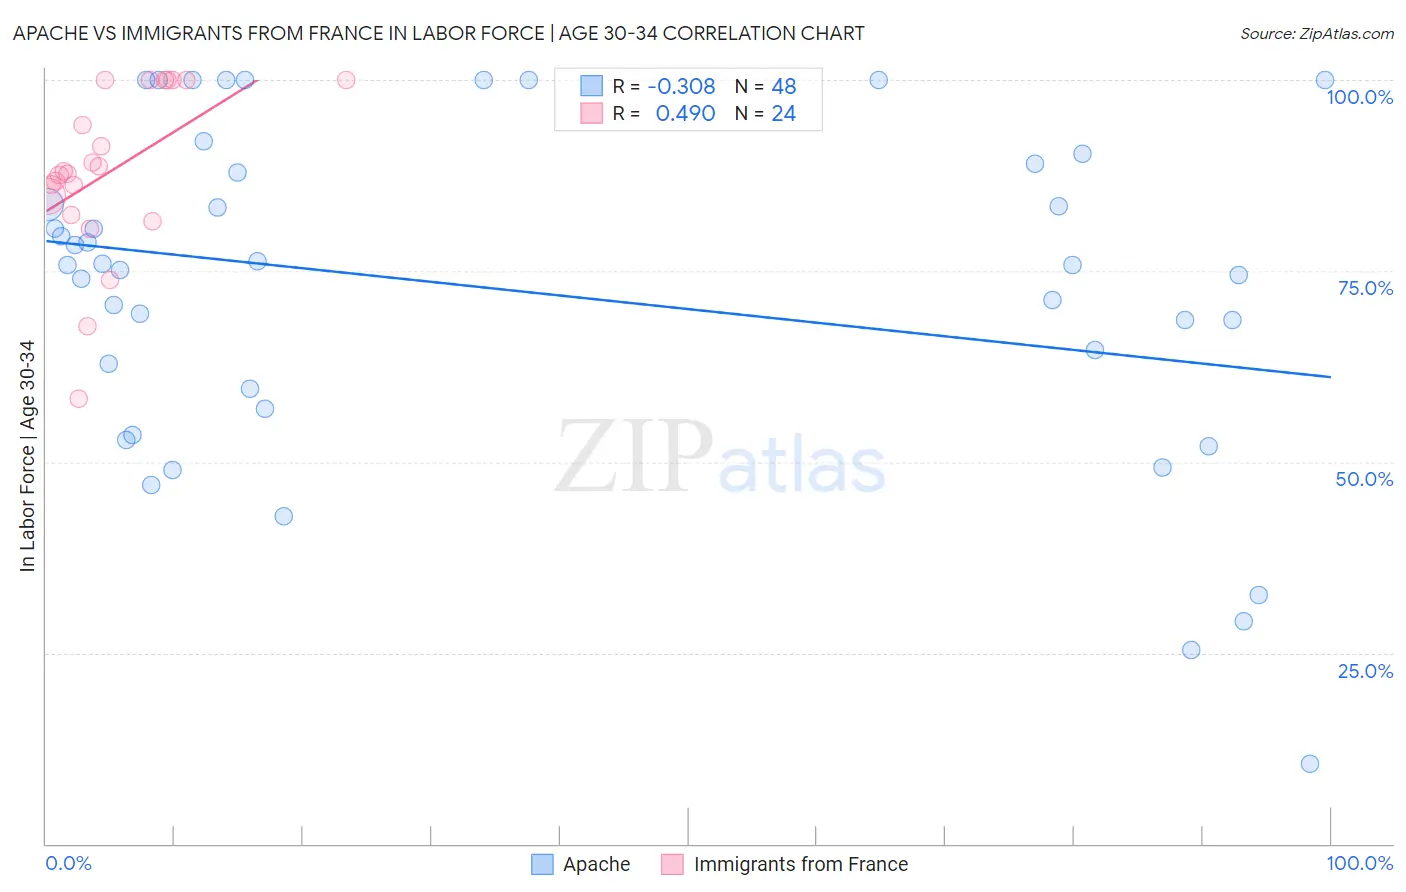
Apache vs Immigrants from France In Labor Force | Age 30-34 Correlation Chart
The statistical analysis conducted on geographies consisting of 231,033,691 people shows a mild negative correlation between the proportion of Apache and labor force participation rate among population between the ages 30 and 34 in the United States with a correlation coefficient (R) of -0.308 and weighted average of 79.0%. Similarly, the statistical analysis conducted on geographies consisting of 287,830,684 people shows a moderate positive correlation between the proportion of Immigrants from France and labor force participation rate among population between the ages 30 and 34 in the United States with a correlation coefficient (R) of 0.490 and weighted average of 85.5%, a difference of 8.2%.
In Labor Force | Age 30-34 Correlation Summary
| Measurement | Apache | Immigrants from France |
| Minimum | 10.5% | 58.2% |
| Maximum | 100.0% | 100.0% |
| Range | 89.5% | 41.8% |
| Mean | 72.3% | 88.1% |
| Median | 75.7% | 87.9% |
| Interquartile 25% (IQ1) | 58.3% | 83.6% |
| Interquartile 75% (IQ3) | 88.5% | 100.0% |
| Interquartile Range (IQR) | 30.2% | 16.4% |
| Standard Deviation (Sample) | 21.9% | 10.8% |
| Standard Deviation (Population) | 21.7% | 10.6% |
Similar Demographics by In Labor Force | Age 30-34
Demographics Similar to Apache by In Labor Force | Age 30-34
In terms of in labor force | age 30-34, the demographic groups most similar to Apache are Pima (79.0%, a difference of 0.030%), Ute (78.9%, a difference of 0.10%), Yakama (79.1%, a difference of 0.15%), Native/Alaskan (79.2%, a difference of 0.19%), and Marshallese (79.2%, a difference of 0.27%).
| Demographics | Rating | Rank | In Labor Force | Age 30-34 |
| Kiowa | 0.0 /100 | #332 | Tragic 79.8% |
| Inupiat | 0.0 /100 | #333 | Tragic 79.7% |
| Hopi | 0.0 /100 | #334 | Tragic 79.3% |
| Marshallese | 0.0 /100 | #335 | Tragic 79.2% |
| Natives/Alaskans | 0.0 /100 | #336 | Tragic 79.2% |
| Yakama | 0.0 /100 | #337 | Tragic 79.1% |
| Pima | 0.0 /100 | #338 | Tragic 79.0% |
| Apache | 0.0 /100 | #339 | Tragic 79.0% |
| Ute | 0.0 /100 | #340 | Tragic 78.9% |
| Immigrants | Yemen | 0.0 /100 | #341 | Tragic 78.2% |
| Tohono O'odham | 0.0 /100 | #342 | Tragic 77.7% |
| Lumbee | 0.0 /100 | #343 | Tragic 77.3% |
| Yuman | 0.0 /100 | #344 | Tragic 77.1% |
| Yup'ik | 0.0 /100 | #345 | Tragic 76.4% |
| Crow | 0.0 /100 | #346 | Tragic 75.9% |
Demographics Similar to Immigrants from France by In Labor Force | Age 30-34
In terms of in labor force | age 30-34, the demographic groups most similar to Immigrants from France are Immigrants from Brazil (85.5%, a difference of 0.0%), Soviet Union (85.5%, a difference of 0.010%), Macedonian (85.5%, a difference of 0.010%), Immigrants from Poland (85.5%, a difference of 0.020%), and Italian (85.4%, a difference of 0.020%).
| Demographics | Rating | Rank | In Labor Force | Age 30-34 |
| Filipinos | 99.6 /100 | #53 | Exceptional 85.5% |
| Immigrants | Kenya | 99.6 /100 | #54 | Exceptional 85.5% |
| Immigrants | Turkey | 99.6 /100 | #55 | Exceptional 85.5% |
| Czechs | 99.6 /100 | #56 | Exceptional 85.5% |
| Russians | 99.6 /100 | #57 | Exceptional 85.5% |
| Poles | 99.6 /100 | #58 | Exceptional 85.5% |
| Immigrants | Poland | 99.5 /100 | #59 | Exceptional 85.5% |
| Immigrants | France | 99.5 /100 | #60 | Exceptional 85.5% |
| Immigrants | Brazil | 99.5 /100 | #61 | Exceptional 85.5% |
| Soviet Union | 99.4 /100 | #62 | Exceptional 85.5% |
| Macedonians | 99.4 /100 | #63 | Exceptional 85.5% |
| Italians | 99.4 /100 | #64 | Exceptional 85.4% |
| Senegalese | 99.4 /100 | #65 | Exceptional 85.4% |
| Ghanaians | 99.4 /100 | #66 | Exceptional 85.4% |
| Kenyans | 99.3 /100 | #67 | Exceptional 85.4% |