Maltese vs Immigrants from Cambodia Female Unemployment
COMPARE
Maltese
Immigrants from Cambodia
Female Unemployment
Female Unemployment Comparison
Maltese
Immigrants from Cambodia
5.1%
FEMALE UNEMPLOYMENT
85.5/ 100
METRIC RATING
130th/ 347
METRIC RANK
5.5%
FEMALE UNEMPLOYMENT
3.3/ 100
METRIC RATING
236th/ 347
METRIC RANK
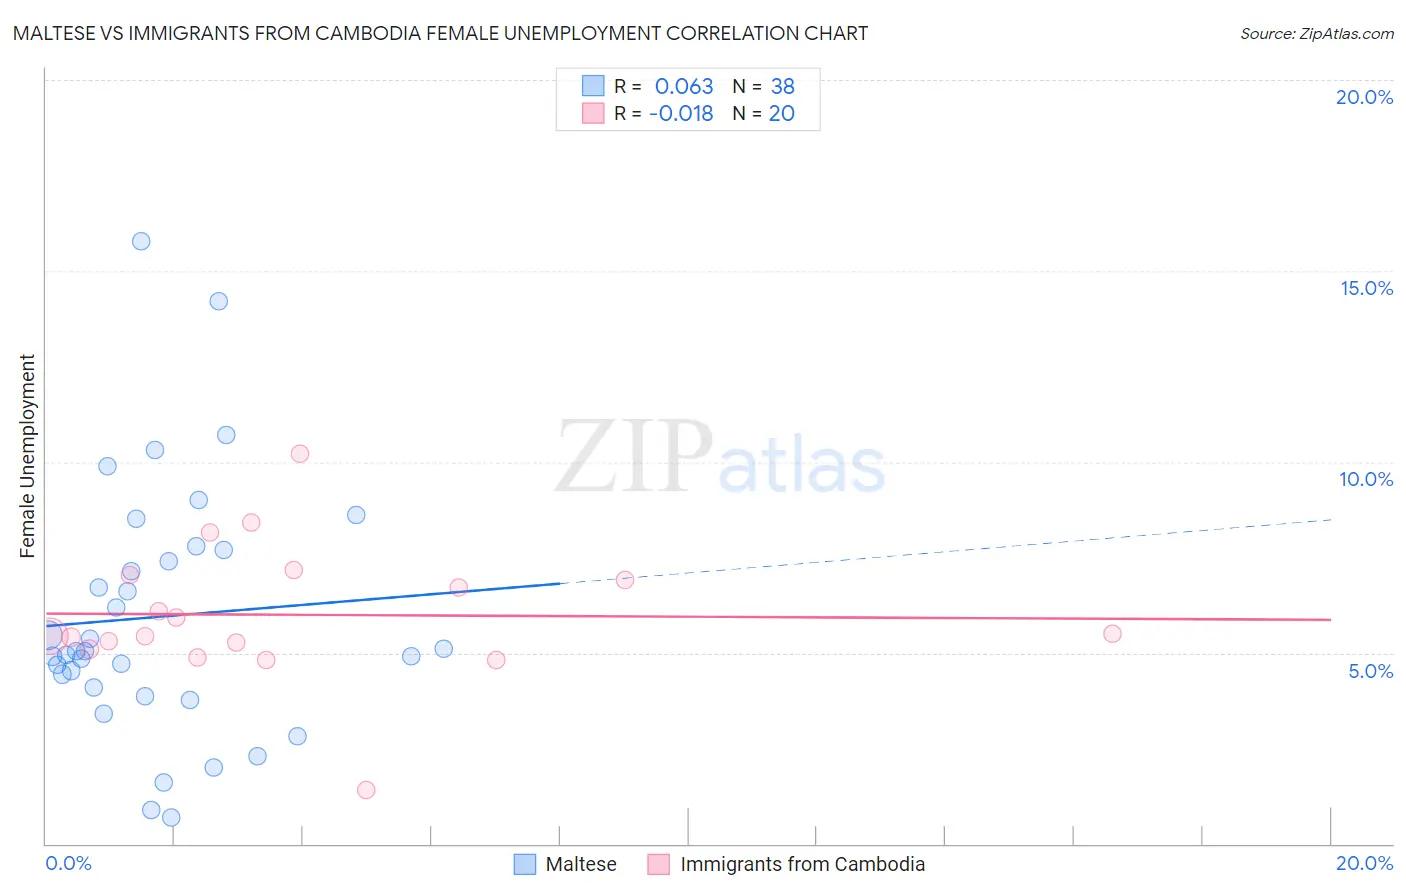
Maltese vs Immigrants from Cambodia Female Unemployment Correlation Chart
The statistical analysis conducted on geographies consisting of 126,272,771 people shows a slight positive correlation between the proportion of Maltese and unemploymnet rate among females in the United States with a correlation coefficient (R) of 0.063 and weighted average of 5.1%. Similarly, the statistical analysis conducted on geographies consisting of 204,858,353 people shows no correlation between the proportion of Immigrants from Cambodia and unemploymnet rate among females in the United States with a correlation coefficient (R) of -0.018 and weighted average of 5.5%, a difference of 8.0%.
Female Unemployment Correlation Summary
| Measurement | Maltese | Immigrants from Cambodia |
| Minimum | 0.70% | 1.4% |
| Maximum | 15.8% | 10.2% |
| Range | 15.1% | 8.8% |
| Mean | 5.9% | 6.0% |
| Median | 5.0% | 5.5% |
| Interquartile 25% (IQ1) | 4.1% | 5.2% |
| Interquartile 75% (IQ3) | 7.7% | 7.0% |
| Interquartile Range (IQR) | 3.6% | 1.8% |
| Standard Deviation (Sample) | 3.3% | 1.8% |
| Standard Deviation (Population) | 3.2% | 1.7% |
Similar Demographics by Female Unemployment
Demographics Similar to Maltese by Female Unemployment
In terms of female unemployment, the demographic groups most similar to Maltese are Immigrants from Ethiopia (5.1%, a difference of 0.020%), Ethiopian (5.1%, a difference of 0.030%), Chilean (5.1%, a difference of 0.040%), Immigrants from Hungary (5.1%, a difference of 0.070%), and Immigrants from Sri Lanka (5.1%, a difference of 0.070%).
| Demographics | Rating | Rank | Female Unemployment |
| Immigrants | South Africa | 87.6 /100 | #123 | Excellent 5.1% |
| Immigrants | Europe | 87.2 /100 | #124 | Excellent 5.1% |
| Basques | 86.5 /100 | #125 | Excellent 5.1% |
| Immigrants | Korea | 86.3 /100 | #126 | Excellent 5.1% |
| Immigrants | Hungary | 86.0 /100 | #127 | Excellent 5.1% |
| Chileans | 85.8 /100 | #128 | Excellent 5.1% |
| Ethiopians | 85.7 /100 | #129 | Excellent 5.1% |
| Maltese | 85.5 /100 | #130 | Excellent 5.1% |
| Immigrants | Ethiopia | 85.4 /100 | #131 | Excellent 5.1% |
| Immigrants | Sri Lanka | 85.0 /100 | #132 | Excellent 5.1% |
| Immigrants | Hong Kong | 84.8 /100 | #133 | Excellent 5.1% |
| Immigrants | Eritrea | 84.6 /100 | #134 | Excellent 5.1% |
| Immigrants | Latvia | 84.6 /100 | #135 | Excellent 5.1% |
| Indians (Asian) | 84.2 /100 | #136 | Excellent 5.1% |
| Pakistanis | 83.8 /100 | #137 | Excellent 5.1% |
Demographics Similar to Immigrants from Cambodia by Female Unemployment
In terms of female unemployment, the demographic groups most similar to Immigrants from Cambodia are Immigrants from Panama (5.5%, a difference of 0.020%), Immigrants from Iran (5.5%, a difference of 0.030%), Immigrants from Lebanon (5.5%, a difference of 0.040%), Sierra Leonean (5.5%, a difference of 0.040%), and Moroccan (5.5%, a difference of 0.060%).
| Demographics | Rating | Rank | Female Unemployment |
| Panamanians | 4.7 /100 | #229 | Tragic 5.5% |
| Immigrants | Uruguay | 4.7 /100 | #230 | Tragic 5.5% |
| Immigrants | Iraq | 3.9 /100 | #231 | Tragic 5.5% |
| Liberians | 3.9 /100 | #232 | Tragic 5.5% |
| Moroccans | 3.4 /100 | #233 | Tragic 5.5% |
| Immigrants | Lebanon | 3.3 /100 | #234 | Tragic 5.5% |
| Immigrants | Iran | 3.3 /100 | #235 | Tragic 5.5% |
| Immigrants | Cambodia | 3.3 /100 | #236 | Tragic 5.5% |
| Immigrants | Panama | 3.2 /100 | #237 | Tragic 5.5% |
| Sierra Leoneans | 3.2 /100 | #238 | Tragic 5.5% |
| Aleuts | 3.0 /100 | #239 | Tragic 5.5% |
| Immigrants | South America | 2.9 /100 | #240 | Tragic 5.5% |
| South American Indians | 2.8 /100 | #241 | Tragic 5.5% |
| Marshallese | 2.3 /100 | #242 | Tragic 5.6% |
| Spanish Americans | 2.2 /100 | #243 | Tragic 5.6% |