Alsatian vs Immigrants from North America Male Unemployment
COMPARE
Alsatian
Immigrants from North America
Male Unemployment
Male Unemployment Comparison
Alsatians
Immigrants from North America
5.4%
MALE UNEMPLOYMENT
16.7/ 100
METRIC RATING
197th/ 347
METRIC RANK
5.0%
MALE UNEMPLOYMENT
96.9/ 100
METRIC RATING
74th/ 347
METRIC RANK
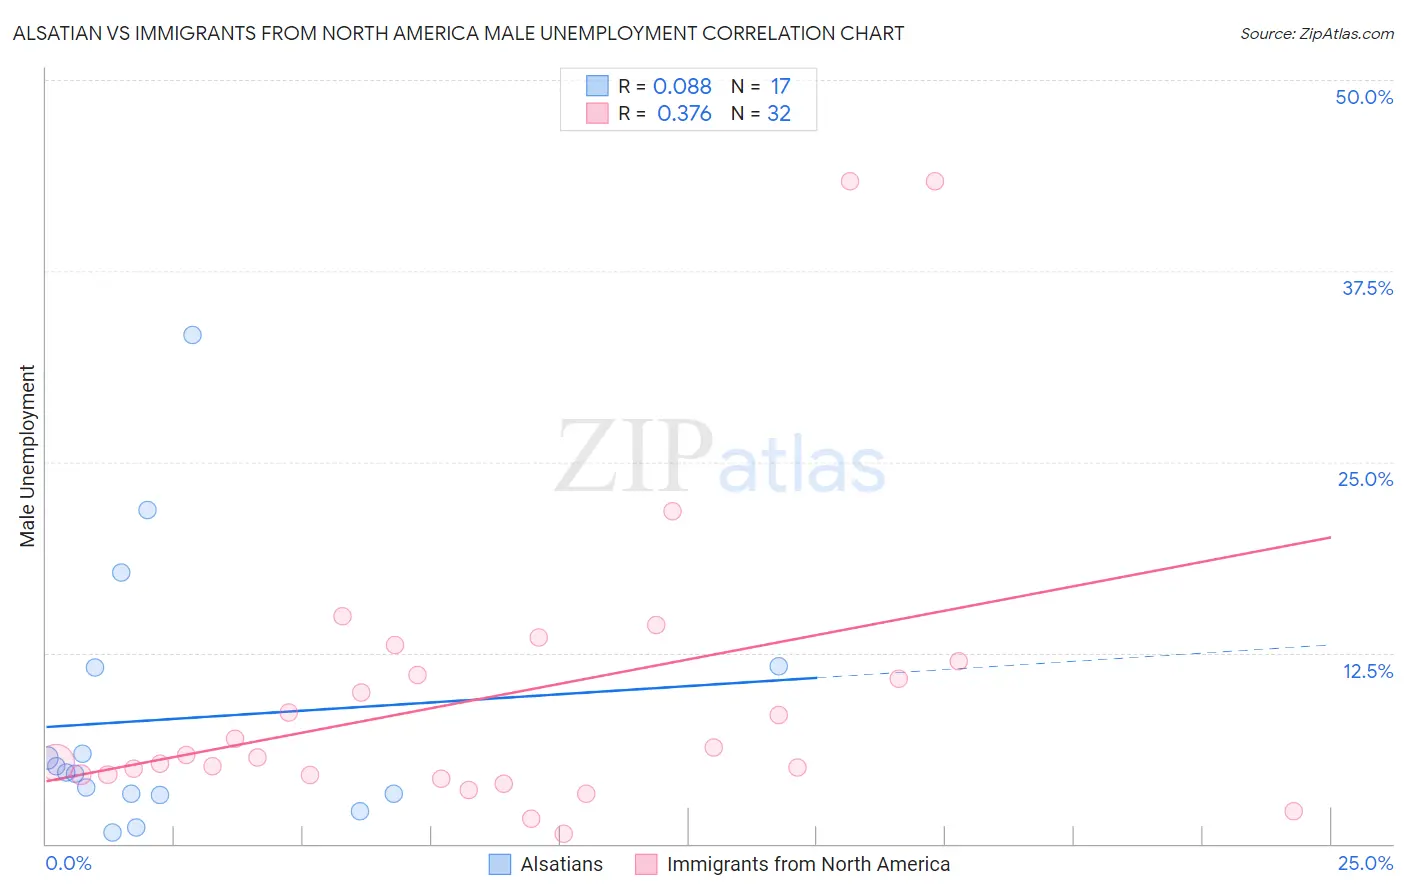
Alsatian vs Immigrants from North America Male Unemployment Correlation Chart
The statistical analysis conducted on geographies consisting of 82,581,733 people shows a slight positive correlation between the proportion of Alsatians and unemployment rate among males in the United States with a correlation coefficient (R) of 0.088 and weighted average of 5.4%. Similarly, the statistical analysis conducted on geographies consisting of 459,389,542 people shows a mild positive correlation between the proportion of Immigrants from North America and unemployment rate among males in the United States with a correlation coefficient (R) of 0.376 and weighted average of 5.0%, a difference of 7.8%.
Male Unemployment Correlation Summary
| Measurement | Alsatian | Immigrants from North America |
| Minimum | 0.70% | 0.66% |
| Maximum | 33.3% | 43.4% |
| Range | 32.6% | 42.7% |
| Mean | 8.2% | 9.6% |
| Median | 4.7% | 5.8% |
| Interquartile 25% (IQ1) | 3.3% | 4.5% |
| Interquartile 75% (IQ3) | 11.6% | 11.5% |
| Interquartile Range (IQR) | 8.3% | 7.0% |
| Standard Deviation (Sample) | 8.7% | 10.0% |
| Standard Deviation (Population) | 8.5% | 9.8% |
Similar Demographics by Male Unemployment
Demographics Similar to Alsatians by Male Unemployment
In terms of male unemployment, the demographic groups most similar to Alsatians are Albanian (5.4%, a difference of 0.060%), Immigrants from Southern Europe (5.4%, a difference of 0.10%), Immigrants from Thailand (5.4%, a difference of 0.22%), Immigrants from Greece (5.4%, a difference of 0.24%), and Spanish (5.4%, a difference of 0.28%).
| Demographics | Rating | Rank | Male Unemployment |
| Immigrants | Uganda | 28.8 /100 | #190 | Fair 5.4% |
| Immigrants | South Eastern Asia | 28.2 /100 | #191 | Fair 5.4% |
| Immigrants | Belarus | 26.0 /100 | #192 | Fair 5.4% |
| Immigrants | Israel | 25.2 /100 | #193 | Fair 5.4% |
| Spanish | 19.7 /100 | #194 | Poor 5.4% |
| Immigrants | Southern Europe | 17.7 /100 | #195 | Poor 5.4% |
| Albanians | 17.3 /100 | #196 | Poor 5.4% |
| Alsatians | 16.7 /100 | #197 | Poor 5.4% |
| Immigrants | Thailand | 14.7 /100 | #198 | Poor 5.4% |
| Immigrants | Greece | 14.5 /100 | #199 | Poor 5.4% |
| Immigrants | Zaire | 13.7 /100 | #200 | Poor 5.4% |
| Immigrants | Philippines | 13.5 /100 | #201 | Poor 5.4% |
| Immigrants | Nonimmigrants | 13.1 /100 | #202 | Poor 5.4% |
| Immigrants | Laos | 13.0 /100 | #203 | Poor 5.4% |
| Guamanians/Chamorros | 12.3 /100 | #204 | Poor 5.4% |
Demographics Similar to Immigrants from North America by Male Unemployment
In terms of male unemployment, the demographic groups most similar to Immigrants from North America are Greek (5.0%, a difference of 0.030%), Assyrian/Chaldean/Syriac (5.0%, a difference of 0.030%), Immigrants from South Africa (5.0%, a difference of 0.11%), New Zealander (5.0%, a difference of 0.19%), and Immigrants from Sudan (5.0%, a difference of 0.19%).
| Demographics | Rating | Rank | Male Unemployment |
| Immigrants | Canada | 97.5 /100 | #67 | Exceptional 5.0% |
| Australians | 97.4 /100 | #68 | Exceptional 5.0% |
| Immigrants | Sweden | 97.4 /100 | #69 | Exceptional 5.0% |
| Whites/Caucasians | 97.3 /100 | #70 | Exceptional 5.0% |
| New Zealanders | 97.3 /100 | #71 | Exceptional 5.0% |
| Immigrants | South Africa | 97.1 /100 | #72 | Exceptional 5.0% |
| Greeks | 97.0 /100 | #73 | Exceptional 5.0% |
| Immigrants | North America | 96.9 /100 | #74 | Exceptional 5.0% |
| Assyrians/Chaldeans/Syriacs | 96.9 /100 | #75 | Exceptional 5.0% |
| Immigrants | Sudan | 96.5 /100 | #76 | Exceptional 5.0% |
| Iranians | 96.4 /100 | #77 | Exceptional 5.0% |
| Immigrants | Northern Europe | 96.4 /100 | #78 | Exceptional 5.0% |
| South Africans | 96.4 /100 | #79 | Exceptional 5.0% |
| Argentineans | 96.2 /100 | #80 | Exceptional 5.0% |
| French | 96.2 /100 | #81 | Exceptional 5.0% |