English vs Immigrants from North America Male Unemployment
COMPARE
English
Immigrants from North America
Male Unemployment
Male Unemployment Comparison
English
Immigrants from North America
4.8%
MALE UNEMPLOYMENT
99.9/ 100
METRIC RATING
18th/ 347
METRIC RANK
5.0%
MALE UNEMPLOYMENT
96.9/ 100
METRIC RATING
74th/ 347
METRIC RANK
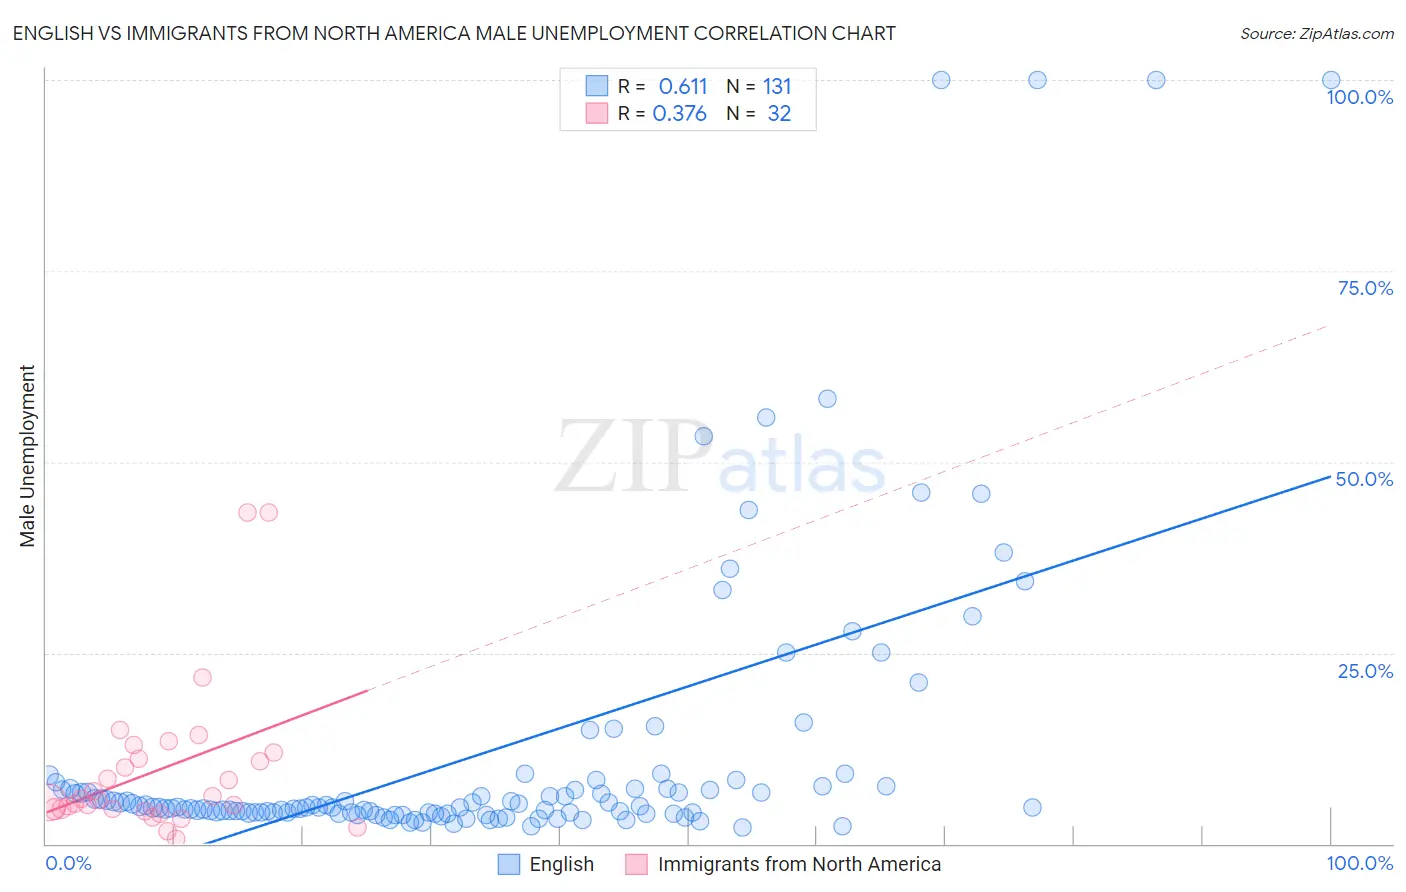
English vs Immigrants from North America Male Unemployment Correlation Chart
The statistical analysis conducted on geographies consisting of 566,278,117 people shows a significant positive correlation between the proportion of English and unemployment rate among males in the United States with a correlation coefficient (R) of 0.611 and weighted average of 4.8%. Similarly, the statistical analysis conducted on geographies consisting of 459,389,542 people shows a mild positive correlation between the proportion of Immigrants from North America and unemployment rate among males in the United States with a correlation coefficient (R) of 0.376 and weighted average of 5.0%, a difference of 5.7%.
Male Unemployment Correlation Summary
| Measurement | English | Immigrants from North America |
| Minimum | 2.2% | 0.66% |
| Maximum | 100.0% | 43.4% |
| Range | 97.8% | 42.7% |
| Mean | 12.0% | 9.6% |
| Median | 4.8% | 5.8% |
| Interquartile 25% (IQ1) | 4.0% | 4.5% |
| Interquartile 75% (IQ3) | 7.3% | 11.5% |
| Interquartile Range (IQR) | 3.2% | 7.0% |
| Standard Deviation (Sample) | 19.4% | 10.0% |
| Standard Deviation (Population) | 19.3% | 9.8% |
Similar Demographics by Male Unemployment
Demographics Similar to English by Male Unemployment
In terms of male unemployment, the demographic groups most similar to English are European (4.8%, a difference of 0.030%), Pennsylvania German (4.8%, a difference of 0.080%), Immigrants from Taiwan (4.8%, a difference of 0.24%), Carpatho Rusyn (4.8%, a difference of 0.26%), and Filipino (4.7%, a difference of 0.30%).
| Demographics | Rating | Rank | Male Unemployment |
| Swedes | 100.0 /100 | #11 | Exceptional 4.6% |
| Immigrants | Bolivia | 100.0 /100 | #12 | Exceptional 4.7% |
| Bolivians | 100.0 /100 | #13 | Exceptional 4.7% |
| Germans | 100.0 /100 | #14 | Exceptional 4.7% |
| Scandinavians | 100.0 /100 | #15 | Exceptional 4.7% |
| Swiss | 99.9 /100 | #16 | Exceptional 4.7% |
| Filipinos | 99.9 /100 | #17 | Exceptional 4.7% |
| English | 99.9 /100 | #18 | Exceptional 4.8% |
| Europeans | 99.9 /100 | #19 | Exceptional 4.8% |
| Pennsylvania Germans | 99.9 /100 | #20 | Exceptional 4.8% |
| Immigrants | Taiwan | 99.9 /100 | #21 | Exceptional 4.8% |
| Carpatho Rusyns | 99.9 /100 | #22 | Exceptional 4.8% |
| Tongans | 99.9 /100 | #23 | Exceptional 4.8% |
| Immigrants | South Central Asia | 99.9 /100 | #24 | Exceptional 4.8% |
| Zimbabweans | 99.9 /100 | #25 | Exceptional 4.8% |
Demographics Similar to Immigrants from North America by Male Unemployment
In terms of male unemployment, the demographic groups most similar to Immigrants from North America are Greek (5.0%, a difference of 0.030%), Assyrian/Chaldean/Syriac (5.0%, a difference of 0.030%), Immigrants from South Africa (5.0%, a difference of 0.11%), New Zealander (5.0%, a difference of 0.19%), and Immigrants from Sudan (5.0%, a difference of 0.19%).
| Demographics | Rating | Rank | Male Unemployment |
| Immigrants | Canada | 97.5 /100 | #67 | Exceptional 5.0% |
| Australians | 97.4 /100 | #68 | Exceptional 5.0% |
| Immigrants | Sweden | 97.4 /100 | #69 | Exceptional 5.0% |
| Whites/Caucasians | 97.3 /100 | #70 | Exceptional 5.0% |
| New Zealanders | 97.3 /100 | #71 | Exceptional 5.0% |
| Immigrants | South Africa | 97.1 /100 | #72 | Exceptional 5.0% |
| Greeks | 97.0 /100 | #73 | Exceptional 5.0% |
| Immigrants | North America | 96.9 /100 | #74 | Exceptional 5.0% |
| Assyrians/Chaldeans/Syriacs | 96.9 /100 | #75 | Exceptional 5.0% |
| Immigrants | Sudan | 96.5 /100 | #76 | Exceptional 5.0% |
| Iranians | 96.4 /100 | #77 | Exceptional 5.0% |
| Immigrants | Northern Europe | 96.4 /100 | #78 | Exceptional 5.0% |
| South Africans | 96.4 /100 | #79 | Exceptional 5.0% |
| Argentineans | 96.2 /100 | #80 | Exceptional 5.0% |
| French | 96.2 /100 | #81 | Exceptional 5.0% |