Alsatian vs Immigrants from Poland Male Unemployment
COMPARE
Alsatian
Immigrants from Poland
Male Unemployment
Male Unemployment Comparison
Alsatians
Immigrants from Poland
5.4%
MALE UNEMPLOYMENT
16.7/ 100
METRIC RATING
197th/ 347
METRIC RANK
5.3%
MALE UNEMPLOYMENT
46.0/ 100
METRIC RATING
176th/ 347
METRIC RANK
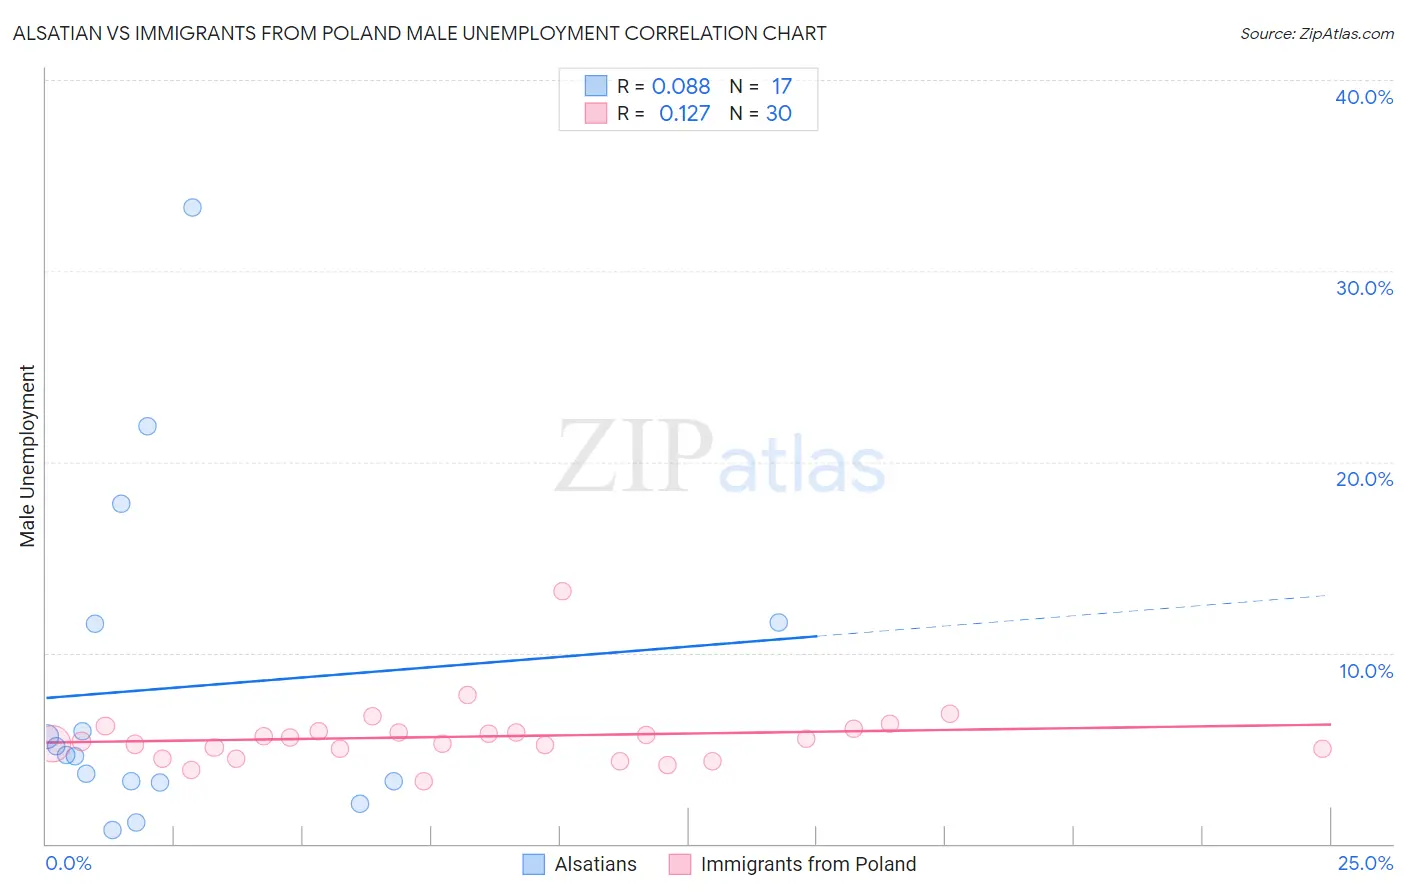
Alsatian vs Immigrants from Poland Male Unemployment Correlation Chart
The statistical analysis conducted on geographies consisting of 82,581,733 people shows a slight positive correlation between the proportion of Alsatians and unemployment rate among males in the United States with a correlation coefficient (R) of 0.088 and weighted average of 5.4%. Similarly, the statistical analysis conducted on geographies consisting of 304,027,535 people shows a poor positive correlation between the proportion of Immigrants from Poland and unemployment rate among males in the United States with a correlation coefficient (R) of 0.127 and weighted average of 5.3%, a difference of 2.1%.
Male Unemployment Correlation Summary
| Measurement | Alsatian | Immigrants from Poland |
| Minimum | 0.70% | 3.3% |
| Maximum | 33.3% | 13.2% |
| Range | 32.6% | 9.9% |
| Mean | 8.2% | 5.6% |
| Median | 4.7% | 5.4% |
| Interquartile 25% (IQ1) | 3.3% | 4.9% |
| Interquartile 75% (IQ3) | 11.6% | 5.9% |
| Interquartile Range (IQR) | 8.3% | 0.93% |
| Standard Deviation (Sample) | 8.7% | 1.7% |
| Standard Deviation (Population) | 8.5% | 1.7% |
Similar Demographics by Male Unemployment
Demographics Similar to Alsatians by Male Unemployment
In terms of male unemployment, the demographic groups most similar to Alsatians are Albanian (5.4%, a difference of 0.060%), Immigrants from Southern Europe (5.4%, a difference of 0.10%), Immigrants from Thailand (5.4%, a difference of 0.22%), Immigrants from Greece (5.4%, a difference of 0.24%), and Spanish (5.4%, a difference of 0.28%).
| Demographics | Rating | Rank | Male Unemployment |
| Immigrants | Uganda | 28.8 /100 | #190 | Fair 5.4% |
| Immigrants | South Eastern Asia | 28.2 /100 | #191 | Fair 5.4% |
| Immigrants | Belarus | 26.0 /100 | #192 | Fair 5.4% |
| Immigrants | Israel | 25.2 /100 | #193 | Fair 5.4% |
| Spanish | 19.7 /100 | #194 | Poor 5.4% |
| Immigrants | Southern Europe | 17.7 /100 | #195 | Poor 5.4% |
| Albanians | 17.3 /100 | #196 | Poor 5.4% |
| Alsatians | 16.7 /100 | #197 | Poor 5.4% |
| Immigrants | Thailand | 14.7 /100 | #198 | Poor 5.4% |
| Immigrants | Greece | 14.5 /100 | #199 | Poor 5.4% |
| Immigrants | Zaire | 13.7 /100 | #200 | Poor 5.4% |
| Immigrants | Philippines | 13.5 /100 | #201 | Poor 5.4% |
| Immigrants | Nonimmigrants | 13.1 /100 | #202 | Poor 5.4% |
| Immigrants | Laos | 13.0 /100 | #203 | Poor 5.4% |
| Guamanians/Chamorros | 12.3 /100 | #204 | Poor 5.4% |
Demographics Similar to Immigrants from Poland by Male Unemployment
In terms of male unemployment, the demographic groups most similar to Immigrants from Poland are Immigrants from Peru (5.3%, a difference of 0.080%), Immigrants from Iraq (5.3%, a difference of 0.12%), Osage (5.3%, a difference of 0.21%), Immigrants from Iran (5.3%, a difference of 0.23%), and Immigrants from Kazakhstan (5.3%, a difference of 0.28%).
| Demographics | Rating | Rank | Male Unemployment |
| Immigrants | Congo | 57.4 /100 | #169 | Average 5.3% |
| Immigrants | Eastern Europe | 54.1 /100 | #170 | Average 5.3% |
| Peruvians | 51.9 /100 | #171 | Average 5.3% |
| Immigrants | Kazakhstan | 50.8 /100 | #172 | Average 5.3% |
| Immigrants | Russia | 50.7 /100 | #173 | Average 5.3% |
| Immigrants | Iran | 50.0 /100 | #174 | Average 5.3% |
| Immigrants | Iraq | 48.1 /100 | #175 | Average 5.3% |
| Immigrants | Poland | 46.0 /100 | #176 | Average 5.3% |
| Immigrants | Peru | 44.6 /100 | #177 | Average 5.3% |
| Osage | 42.5 /100 | #178 | Average 5.3% |
| Immigrants | Oceania | 40.8 /100 | #179 | Average 5.3% |
| Malaysians | 39.6 /100 | #180 | Fair 5.3% |
| Immigrants | Afghanistan | 37.9 /100 | #181 | Fair 5.3% |
| Potawatomi | 37.8 /100 | #182 | Fair 5.3% |
| Taiwanese | 37.6 /100 | #183 | Fair 5.3% |