Alsatian vs Indonesian Male Unemployment

COMPARE

Alsatian
Race
Ancestry
AfghanAfricanAlaska NativeAlaskan AthabascanAlbanianAleutAlsatianAmericanApacheArabArapahoArgentineanArmenianAssyrian/Chaldean/SyriacAustralianAustrianBahamianBangladeshiBarbadianBasqueBelgianBelizeanBermudanBhutaneseBlackfeetBolivianBrazilianBritishBritish West IndianBulgarianBurmeseCajunCambodianCanadianCape VerdeanCarpatho RusynCelticCentral AmericanCentral American IndianCherokeeCheyenneChickasawChileanChineseChippewaChoctawColombianColvilleComancheCosta RicanCreeCreekCroatianCrowCubanCypriotCzechCzechoslovakianDanishDelawareDominicanDutchDutch West IndianEastern EuropeanEcuadorianEgyptianEnglishEstonianEthiopianEuropeanFijianFilipinoFinnishFrenchFrench American IndianFrench CanadianGermanGerman RussianGhanaianGreekGuamanian/ChamorroGuatemalanGuyaneseHaitianHmongHonduranHopiHoumaHungarianIcelanderIndian (Asian)InupiatIranianIraqiIrishIroquoisIsraeliItalianJamaicanJapaneseJordanianKenyanKiowaKoreanLaotianLatvianLebaneseLiberianLithuanianLumbeeLuxembourgerMacedonianMalaysianMalteseMarshalleseMenomineeMexicanMexican American IndianMongolianMoroccanNative HawaiianNavajoNepaleseNew ZealanderNicaraguanNigerianNorthern EuropeanNorwegianOkinawanOsageOttawaPaiutePakistaniPalestinianPanamanianParaguayanPennsylvania GermanPeruvianPimaPolishPortuguesePotawatomiPuebloPuerto RicanPuget Sound SalishRomanianRussianSalvadoranSamoanScandinavianScotch-IrishScottishSeminoleSenegaleseSerbianShoshoneSierra LeoneanSiouxSlavicSlovakSloveneSomaliSouth AfricanSouth AmericanSouth American IndianSoviet UnionSpaniardSpanishSpanish AmericanSpanish American IndianSri LankanSubsaharan AfricanSudaneseSwedishSwissSyrianTaiwaneseThaiTlingit-HaidaTohono O'OdhamTonganTrinidadian and TobagonianTsimshianTurkishU.S. Virgin IslanderUgandanUkrainianUruguayanUteVenezuelanVietnameseWelshWest IndianYakamaYaquiYugoslavianYumanYup'ikZimbabwean
Immigration
NonimmigrantsImmigrantsAfghanistanAfricaAlbaniaArgentinaArmeniaAsiaAustraliaAustriaBahamasBangladeshBarbadosBelarusBelgiumBelizeBoliviaBosnia and HerzegovinaBrazilBulgariaBurma/MyanmarCabo VerdeCambodiaCameroonCanadaCaribbeanCentral AmericaChileChinaColombiaCongoCosta RicaCroatiaCubaCzechoslovakiaDenmarkDominicaDominican RepublicEastern AfricaEastern AsiaEastern EuropeEcuadorEgyptEl SalvadorEnglandEritreaEthiopiaEuropeFijiFranceGermanyGhanaGreeceGrenadaGuatemalaGuyanaHaitiHondurasHong KongHungaryIndiaIndonesiaIranIraqIrelandIsraelItalyJamaicaJapanJordanKazakhstanKenyaKoreaKuwaitLaosLatin AmericaLatviaLebanonLiberiaLithuaniaMalaysiaMexicoMicronesiaMiddle AfricaMoldovaMoroccoNepalNetherlandsNicaraguaNigeriaNorth AmericaNorth MacedoniaNorthern AfricaNorthern EuropeNorwayOceaniaPakistanPanamaPeruPhilippinesPolandPortugalRomaniaRussiaSaudi ArabiaScotlandSenegalSerbiaSierra LeoneSingaporeSomaliaSouth AfricaSouth AmericaSouth Central AsiaSouth Eastern AsiaSouthern EuropeSpainSri LankaSt. Vincent and the GrenadinesSudanSwedenSwitzerlandSyriaTaiwanThailandTrinidad and TobagoTurkeyUgandaUkraineUruguayUzbekistanVenezuelaVietnamWest IndiesWestern AfricaWestern AsiaWestern EuropeYemenZaireZimbabweAzores
Indonesian
Race
Ancestry
AfghanAfricanAlaska NativeAlaskan AthabascanAlbanianAleutAmericanApacheArabArapahoArgentineanArmenianAssyrian/Chaldean/SyriacAustralianAustrianBahamianBangladeshiBarbadianBasqueBelgianBelizeanBermudanBhutaneseBlackfeetBolivianBrazilianBritishBritish West IndianBulgarianBurmeseCajunCambodianCanadianCape VerdeanCarpatho RusynCelticCentral AmericanCentral American IndianCherokeeCheyenneChickasawChileanChineseChippewaChoctawColombianColvilleComancheCosta RicanCreeCreekCroatianCrowCubanCypriotCzechCzechoslovakianDanishDelawareDominicanDutchDutch West IndianEastern EuropeanEcuadorianEgyptianEnglishEstonianEthiopianEuropeanFijianFilipinoFinnishFrenchFrench American IndianFrench CanadianGermanGerman RussianGhanaianGreekGuamanian/ChamorroGuatemalanGuyaneseHaitianHmongHonduranHopiHoumaHungarianIcelanderIndian (Asian)IndonesianInupiatIranianIraqiIrishIroquoisIsraeliItalianJamaicanJapaneseJordanianKenyanKiowaKoreanLaotianLatvianLebaneseLiberianLithuanianLumbeeLuxembourgerMacedonianMalaysianMalteseMarshalleseMenomineeMexicanMexican American IndianMongolianMoroccanNative HawaiianNavajoNepaleseNew ZealanderNicaraguanNigerianNorthern EuropeanNorwegianOkinawanOsageOttawaPaiutePakistaniPalestinianPanamanianParaguayanPennsylvania GermanPeruvianPimaPolishPortuguesePotawatomiPuebloPuerto RicanPuget Sound SalishRomanianRussianSalvadoranSamoanScandinavianScotch-IrishScottishSeminoleSenegaleseSerbianShoshoneSierra LeoneanSiouxSlavicSlovakSloveneSomaliSouth AfricanSouth AmericanSouth American IndianSoviet UnionSpaniardSpanishSpanish AmericanSpanish American IndianSri LankanSubsaharan AfricanSudaneseSwedishSwissSyrianTaiwaneseThaiTlingit-HaidaTohono O'OdhamTonganTrinidadian and TobagonianTsimshianTurkishU.S. Virgin IslanderUgandanUkrainianUruguayanUteVenezuelanVietnameseWelshWest IndianYakamaYaquiYugoslavianYumanYup'ikZimbabwean
Immigration
NonimmigrantsImmigrantsAfghanistanAfricaAlbaniaArgentinaArmeniaAsiaAustraliaAustriaBahamasBangladeshBarbadosBelarusBelgiumBelizeBoliviaBosnia and HerzegovinaBrazilBulgariaBurma/MyanmarCabo VerdeCambodiaCameroonCanadaCaribbeanCentral AmericaChileChinaColombiaCongoCosta RicaCroatiaCubaCzechoslovakiaDenmarkDominicaDominican RepublicEastern AfricaEastern AsiaEastern EuropeEcuadorEgyptEl SalvadorEnglandEritreaEthiopiaEuropeFijiFranceGermanyGhanaGreeceGrenadaGuatemalaGuyanaHaitiHondurasHong KongHungaryIndiaIndonesiaIranIraqIrelandIsraelItalyJamaicaJapanJordanKazakhstanKenyaKoreaKuwaitLaosLatin AmericaLatviaLebanonLiberiaLithuaniaMalaysiaMexicoMicronesiaMiddle AfricaMoldovaMoroccoNepalNetherlandsNicaraguaNigeriaNorth AmericaNorth MacedoniaNorthern AfricaNorthern EuropeNorwayOceaniaPakistanPanamaPeruPhilippinesPolandPortugalRomaniaRussiaSaudi ArabiaScotlandSenegalSerbiaSierra LeoneSingaporeSomaliaSouth AfricaSouth AmericaSouth Central AsiaSouth Eastern AsiaSouthern EuropeSpainSri LankaSt. Vincent and the GrenadinesSudanSwedenSwitzerlandSyriaTaiwanThailandTrinidad and TobagoTurkeyUgandaUkraineUruguayUzbekistanVenezuelaVietnamWest IndiesWestern AfricaWestern AsiaWestern EuropeYemenZaireZimbabweAzores
Male Unemployment
Income
Poverty
Unemployment
Labor Participation
Family Structure
Vehicle Availability
Education Level
Disability

Male Unemployment Comparison

Alsatians

Indonesians

Poor
Good
5.4%
MALE UNEMPLOYMENT
16.7/ 100
METRIC RATING
197th/ 347
METRIC RANK
5.2%
MALE UNEMPLOYMENT
71.2/ 100
METRIC RATING
159th/ 347
METRIC RANK

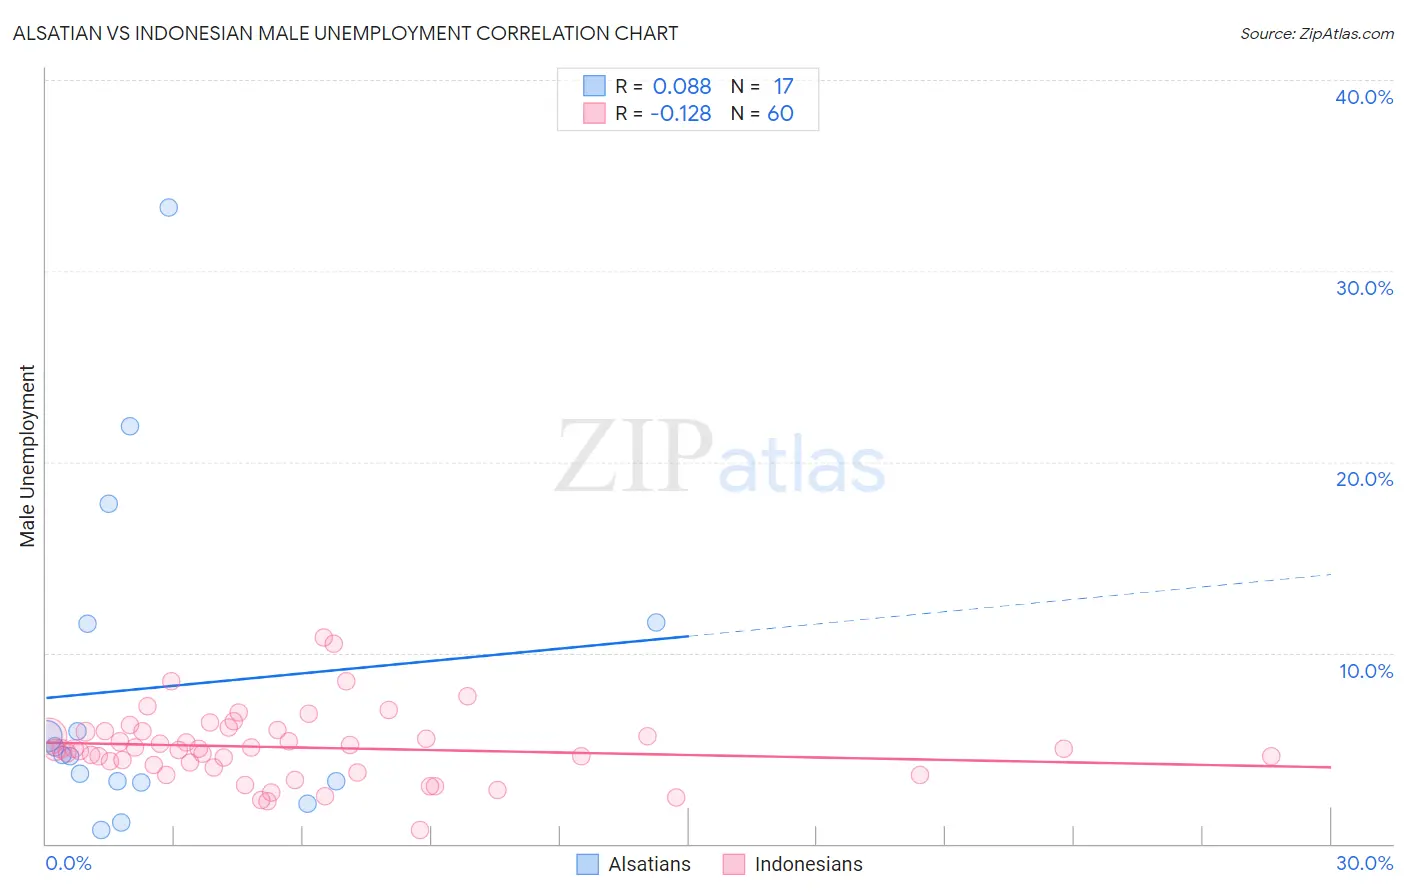
Alsatian vs Indonesian Male Unemployment Correlation Chart

The statistical analysis conducted on geographies consisting of 82,581,733 people shows a slight positive correlation between the proportion of Alsatians and unemployment rate among males in the United States with a correlation coefficient (R) of 0.088 and weighted average of 5.4%. Similarly, the statistical analysis conducted on geographies consisting of 162,567,478 people shows a poor negative correlation between the proportion of Indonesians and unemployment rate among males in the United States with a correlation coefficient (R) of -0.128 and weighted average of 5.2%, a difference of 3.7%.
Alsatian vs Indonesian Male Unemployment

Male Unemployment Correlation Summary

MeasurementAlsatianIndonesian
Minimum0.70%0.70%
Maximum33.3%10.8%
Range32.6%10.1%
Mean8.2%5.0%
Median4.7%5.0%
Interquartile 25% (IQ1)3.3%4.0%
Interquartile 75% (IQ3)11.6%5.9%
Interquartile Range (IQR)8.3%1.8%
Standard Deviation (Sample)8.7%1.9%
Standard Deviation (Population)8.5%1.8%

Similar Demographics by Male Unemployment

Demographics Similar to Alsatians by Male Unemployment

In terms of male unemployment, the demographic groups most similar to Alsatians are Albanian (5.4%, a difference of 0.060%), Immigrants from Southern Europe (5.4%, a difference of 0.10%), Immigrants from Thailand (5.4%, a difference of 0.22%), Immigrants from Greece (5.4%, a difference of 0.24%), and Spanish (5.4%, a difference of 0.28%).
DemographicsRating | RankMale Unemployment
Immigrants | Uganda
28.8
/100
|
#190
Fair
5.4%
Immigrants | South Eastern Asia
28.2
/100
|
#191
Fair
5.4%
Immigrants | Belarus
26.0
/100
|
#192
Fair
5.4%
Immigrants | Israel
25.2
/100
|
#193
Fair
5.4%
Spanish
19.7
/100
|
#194
Poor
5.4%
Immigrants | Southern Europe
17.7
/100
|
#195
Poor
5.4%
Albanians
17.3
/100
|
#196
Poor
5.4%
Alsatians
16.7
/100
|
#197
Poor
5.4%
Immigrants | Thailand
14.7
/100
|
#198
Poor
5.4%
Immigrants | Greece
14.5
/100
|
#199
Poor
5.4%
Immigrants | Zaire
13.7
/100
|
#200
Poor
5.4%
Immigrants | Philippines
13.5
/100
|
#201
Poor
5.4%
Immigrants | Nonimmigrants
13.1
/100
|
#202
Poor
5.4%
Immigrants | Laos
13.0
/100
|
#203
Poor
5.4%
Guamanians/Chamorros
12.3
/100
|
#204
Poor
5.4%

Demographics Similar to Indonesians by Male Unemployment

In terms of male unemployment, the demographic groups most similar to Indonesians are Immigrants from Norway (5.2%, a difference of 0.010%), Immigrants from Indonesia (5.2%, a difference of 0.030%), Immigrants from China (5.2%, a difference of 0.040%), Immigrants from Northern Africa (5.2%, a difference of 0.080%), and American (5.2%, a difference of 0.11%).
DemographicsRating | RankMale Unemployment
Egyptians
74.8
/100
|
#152
Good
5.2%
Immigrants | Uruguay
73.9
/100
|
#153
Good
5.2%
Laotians
73.8
/100
|
#154
Good
5.2%
Immigrants | Hungary
73.4
/100
|
#155
Good
5.2%
Americans
72.7
/100
|
#156
Good
5.2%
Immigrants | Northern Africa
72.3
/100
|
#157
Good
5.2%
Immigrants | Indonesia
71.5
/100
|
#158
Good
5.2%
Indonesians
71.2
/100
|
#159
Good
5.2%
Immigrants | Norway
71.0
/100
|
#160
Good
5.2%
Immigrants | China
70.6
/100
|
#161
Good
5.2%
Immigrants | Egypt
65.9
/100
|
#162
Good
5.2%
Immigrants | Hong Kong
65.7
/100
|
#163
Good
5.2%
Afghans
62.0
/100
|
#164
Good
5.3%
South Americans
60.6
/100
|
#165
Good
5.3%
Immigrants | Morocco
60.2
/100
|
#166
Good
5.3%