Alsatian vs Paiute Male Unemployment
COMPARE
Alsatian
Paiute
Male Unemployment
Male Unemployment Comparison
Alsatians
Paiute
5.4%
MALE UNEMPLOYMENT
16.7/ 100
METRIC RATING
197th/ 347
METRIC RANK
7.7%
MALE UNEMPLOYMENT
0.0/ 100
METRIC RATING
327th/ 347
METRIC RANK
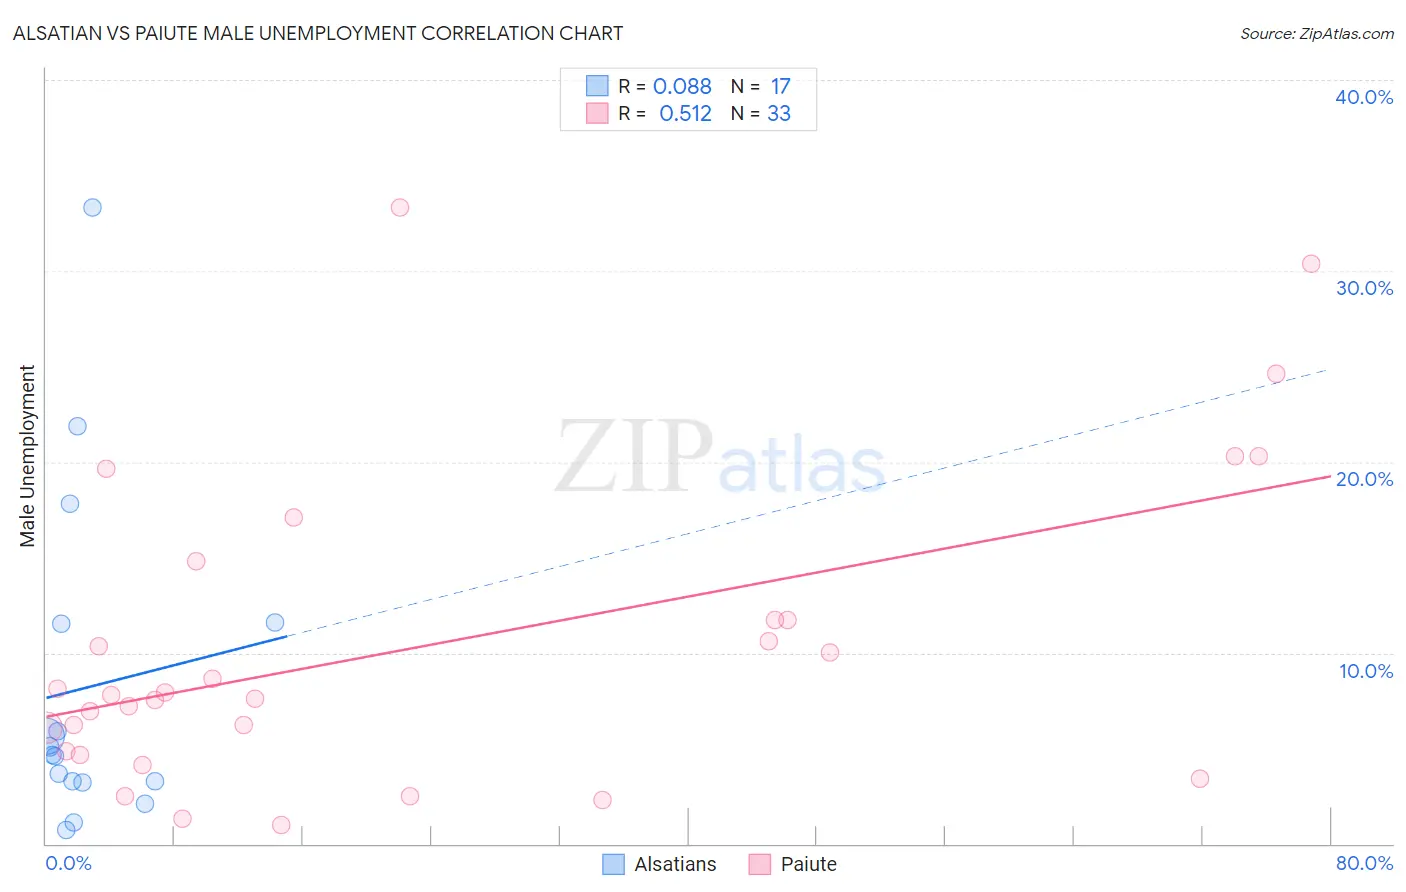
Alsatian vs Paiute Male Unemployment Correlation Chart
The statistical analysis conducted on geographies consisting of 82,581,733 people shows a slight positive correlation between the proportion of Alsatians and unemployment rate among males in the United States with a correlation coefficient (R) of 0.088 and weighted average of 5.4%. Similarly, the statistical analysis conducted on geographies consisting of 58,346,230 people shows a substantial positive correlation between the proportion of Paiute and unemployment rate among males in the United States with a correlation coefficient (R) of 0.512 and weighted average of 7.7%, a difference of 41.9%.
Male Unemployment Correlation Summary
| Measurement | Alsatian | Paiute |
| Minimum | 0.70% | 1.0% |
| Maximum | 33.3% | 33.3% |
| Range | 32.6% | 32.3% |
| Mean | 8.2% | 10.4% |
| Median | 4.7% | 7.8% |
| Interquartile 25% (IQ1) | 3.3% | 4.8% |
| Interquartile 75% (IQ3) | 11.6% | 13.3% |
| Interquartile Range (IQR) | 8.3% | 8.5% |
| Standard Deviation (Sample) | 8.7% | 8.1% |
| Standard Deviation (Population) | 8.5% | 8.0% |
Similar Demographics by Male Unemployment
Demographics Similar to Alsatians by Male Unemployment
In terms of male unemployment, the demographic groups most similar to Alsatians are Albanian (5.4%, a difference of 0.060%), Immigrants from Southern Europe (5.4%, a difference of 0.10%), Immigrants from Thailand (5.4%, a difference of 0.22%), Immigrants from Greece (5.4%, a difference of 0.24%), and Spanish (5.4%, a difference of 0.28%).
| Demographics | Rating | Rank | Male Unemployment |
| Immigrants | Uganda | 28.8 /100 | #190 | Fair 5.4% |
| Immigrants | South Eastern Asia | 28.2 /100 | #191 | Fair 5.4% |
| Immigrants | Belarus | 26.0 /100 | #192 | Fair 5.4% |
| Immigrants | Israel | 25.2 /100 | #193 | Fair 5.4% |
| Spanish | 19.7 /100 | #194 | Poor 5.4% |
| Immigrants | Southern Europe | 17.7 /100 | #195 | Poor 5.4% |
| Albanians | 17.3 /100 | #196 | Poor 5.4% |
| Alsatians | 16.7 /100 | #197 | Poor 5.4% |
| Immigrants | Thailand | 14.7 /100 | #198 | Poor 5.4% |
| Immigrants | Greece | 14.5 /100 | #199 | Poor 5.4% |
| Immigrants | Zaire | 13.7 /100 | #200 | Poor 5.4% |
| Immigrants | Philippines | 13.5 /100 | #201 | Poor 5.4% |
| Immigrants | Nonimmigrants | 13.1 /100 | #202 | Poor 5.4% |
| Immigrants | Laos | 13.0 /100 | #203 | Poor 5.4% |
| Guamanians/Chamorros | 12.3 /100 | #204 | Poor 5.4% |
Demographics Similar to Paiute by Male Unemployment
In terms of male unemployment, the demographic groups most similar to Paiute are Native/Alaskan (7.7%, a difference of 0.38%), Immigrants from Dominican Republic (7.6%, a difference of 1.1%), Shoshone (7.6%, a difference of 1.2%), Immigrants from Yemen (7.8%, a difference of 1.3%), and Dominican (7.6%, a difference of 1.6%).
| Demographics | Rating | Rank | Male Unemployment |
| Colville | 0.0 /100 | #320 | Tragic 7.4% |
| Immigrants | St. Vincent and the Grenadines | 0.0 /100 | #321 | Tragic 7.5% |
| Immigrants | Cabo Verde | 0.0 /100 | #322 | Tragic 7.5% |
| Immigrants | Grenada | 0.0 /100 | #323 | Tragic 7.6% |
| Dominicans | 0.0 /100 | #324 | Tragic 7.6% |
| Shoshone | 0.0 /100 | #325 | Tragic 7.6% |
| Immigrants | Dominican Republic | 0.0 /100 | #326 | Tragic 7.6% |
| Paiute | 0.0 /100 | #327 | Tragic 7.7% |
| Natives/Alaskans | 0.0 /100 | #328 | Tragic 7.7% |
| Immigrants | Yemen | 0.0 /100 | #329 | Tragic 7.8% |
| Yakama | 0.0 /100 | #330 | Tragic 7.9% |
| Alaska Natives | 0.0 /100 | #331 | Tragic 8.1% |
| Pima | 0.0 /100 | #332 | Tragic 8.3% |
| Sioux | 0.0 /100 | #333 | Tragic 8.4% |
| Tsimshian | 0.0 /100 | #334 | Tragic 8.5% |