Lumbee vs Immigrants from Belarus Male Unemployment
COMPARE
Lumbee
Immigrants from Belarus
Male Unemployment
Male Unemployment Comparison
Lumbee
Immigrants from Belarus
6.9%
MALE UNEMPLOYMENT
0.0/ 100
METRIC RATING
312th/ 347
METRIC RANK
5.4%
MALE UNEMPLOYMENT
26.0/ 100
METRIC RATING
192nd/ 347
METRIC RANK
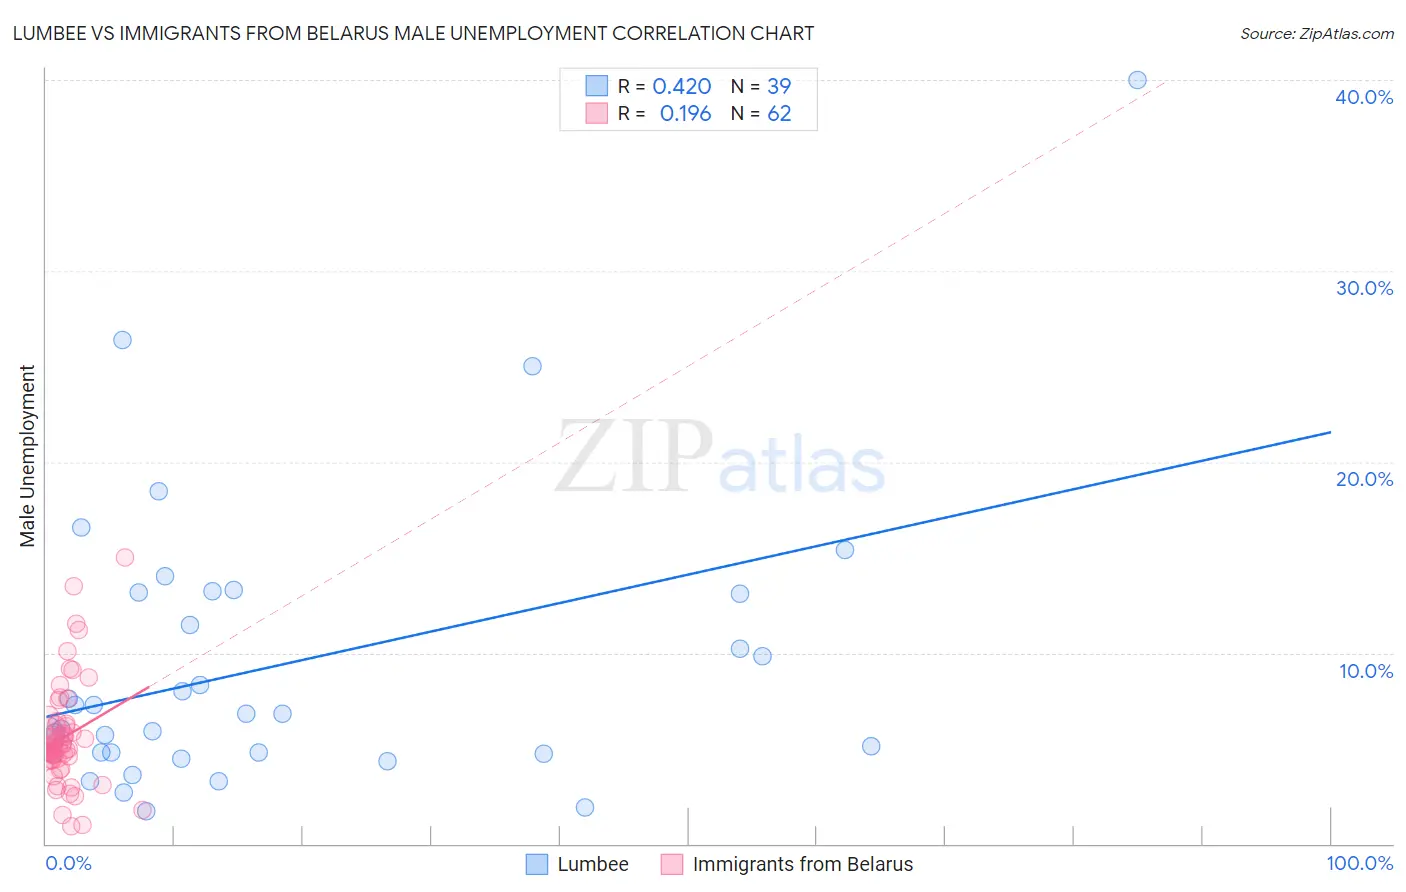
Lumbee vs Immigrants from Belarus Male Unemployment Correlation Chart
The statistical analysis conducted on geographies consisting of 92,069,666 people shows a moderate positive correlation between the proportion of Lumbee and unemployment rate among males in the United States with a correlation coefficient (R) of 0.420 and weighted average of 6.9%. Similarly, the statistical analysis conducted on geographies consisting of 150,060,028 people shows a poor positive correlation between the proportion of Immigrants from Belarus and unemployment rate among males in the United States with a correlation coefficient (R) of 0.196 and weighted average of 5.4%, a difference of 29.0%.
Male Unemployment Correlation Summary
| Measurement | Lumbee | Immigrants from Belarus |
| Minimum | 1.7% | 0.90% |
| Maximum | 40.0% | 15.0% |
| Range | 38.3% | 14.1% |
| Mean | 9.5% | 5.6% |
| Median | 6.8% | 5.1% |
| Interquartile 25% (IQ1) | 4.8% | 4.4% |
| Interquartile 75% (IQ3) | 13.1% | 6.2% |
| Interquartile Range (IQR) | 8.4% | 1.8% |
| Standard Deviation (Sample) | 7.7% | 2.7% |
| Standard Deviation (Population) | 7.6% | 2.7% |
Similar Demographics by Male Unemployment
Demographics Similar to Lumbee by Male Unemployment
In terms of male unemployment, the demographic groups most similar to Lumbee are Immigrants from Armenia (6.9%, a difference of 0.20%), Black/African American (6.9%, a difference of 0.52%), Immigrants from Dominica (7.0%, a difference of 1.0%), Barbadian (6.9%, a difference of 1.2%), and Aleut (6.8%, a difference of 1.6%).
| Demographics | Rating | Rank | Male Unemployment |
| Trinidadians and Tobagonians | 0.0 /100 | #305 | Tragic 6.7% |
| Immigrants | Trinidad and Tobago | 0.0 /100 | #306 | Tragic 6.7% |
| Immigrants | Jamaica | 0.0 /100 | #307 | Tragic 6.7% |
| Aleuts | 0.0 /100 | #308 | Tragic 6.8% |
| Barbadians | 0.0 /100 | #309 | Tragic 6.9% |
| Blacks/African Americans | 0.0 /100 | #310 | Tragic 6.9% |
| Immigrants | Armenia | 0.0 /100 | #311 | Tragic 6.9% |
| Lumbee | 0.0 /100 | #312 | Tragic 6.9% |
| Immigrants | Dominica | 0.0 /100 | #313 | Tragic 7.0% |
| Immigrants | Barbados | 0.0 /100 | #314 | Tragic 7.1% |
| Houma | 0.0 /100 | #315 | Tragic 7.1% |
| Immigrants | Guyana | 0.0 /100 | #316 | Tragic 7.1% |
| Guyanese | 0.0 /100 | #317 | Tragic 7.1% |
| Cape Verdeans | 0.0 /100 | #318 | Tragic 7.1% |
| British West Indians | 0.0 /100 | #319 | Tragic 7.3% |
Demographics Similar to Immigrants from Belarus by Male Unemployment
In terms of male unemployment, the demographic groups most similar to Immigrants from Belarus are Immigrants from Israel (5.4%, a difference of 0.060%), Immigrants from South Eastern Asia (5.4%, a difference of 0.16%), Immigrants from Uganda (5.4%, a difference of 0.20%), Immigrants from South America (5.4%, a difference of 0.24%), and Arab (5.4%, a difference of 0.30%).
| Demographics | Rating | Rank | Male Unemployment |
| Koreans | 34.9 /100 | #185 | Fair 5.3% |
| Iraqis | 31.6 /100 | #186 | Fair 5.4% |
| Costa Ricans | 31.3 /100 | #187 | Fair 5.4% |
| Arabs | 30.2 /100 | #188 | Fair 5.4% |
| Immigrants | South America | 29.4 /100 | #189 | Fair 5.4% |
| Immigrants | Uganda | 28.8 /100 | #190 | Fair 5.4% |
| Immigrants | South Eastern Asia | 28.2 /100 | #191 | Fair 5.4% |
| Immigrants | Belarus | 26.0 /100 | #192 | Fair 5.4% |
| Immigrants | Israel | 25.2 /100 | #193 | Fair 5.4% |
| Spanish | 19.7 /100 | #194 | Poor 5.4% |
| Immigrants | Southern Europe | 17.7 /100 | #195 | Poor 5.4% |
| Albanians | 17.3 /100 | #196 | Poor 5.4% |
| Alsatians | 16.7 /100 | #197 | Poor 5.4% |
| Immigrants | Thailand | 14.7 /100 | #198 | Poor 5.4% |
| Immigrants | Greece | 14.5 /100 | #199 | Poor 5.4% |