Pakistani vs Immigrants from Belarus Male Unemployment
COMPARE
Pakistani
Immigrants from Belarus
Male Unemployment
Male Unemployment Comparison
Pakistanis
Immigrants from Belarus
5.2%
MALE UNEMPLOYMENT
80.5/ 100
METRIC RATING
134th/ 347
METRIC RANK
5.4%
MALE UNEMPLOYMENT
26.0/ 100
METRIC RATING
192nd/ 347
METRIC RANK
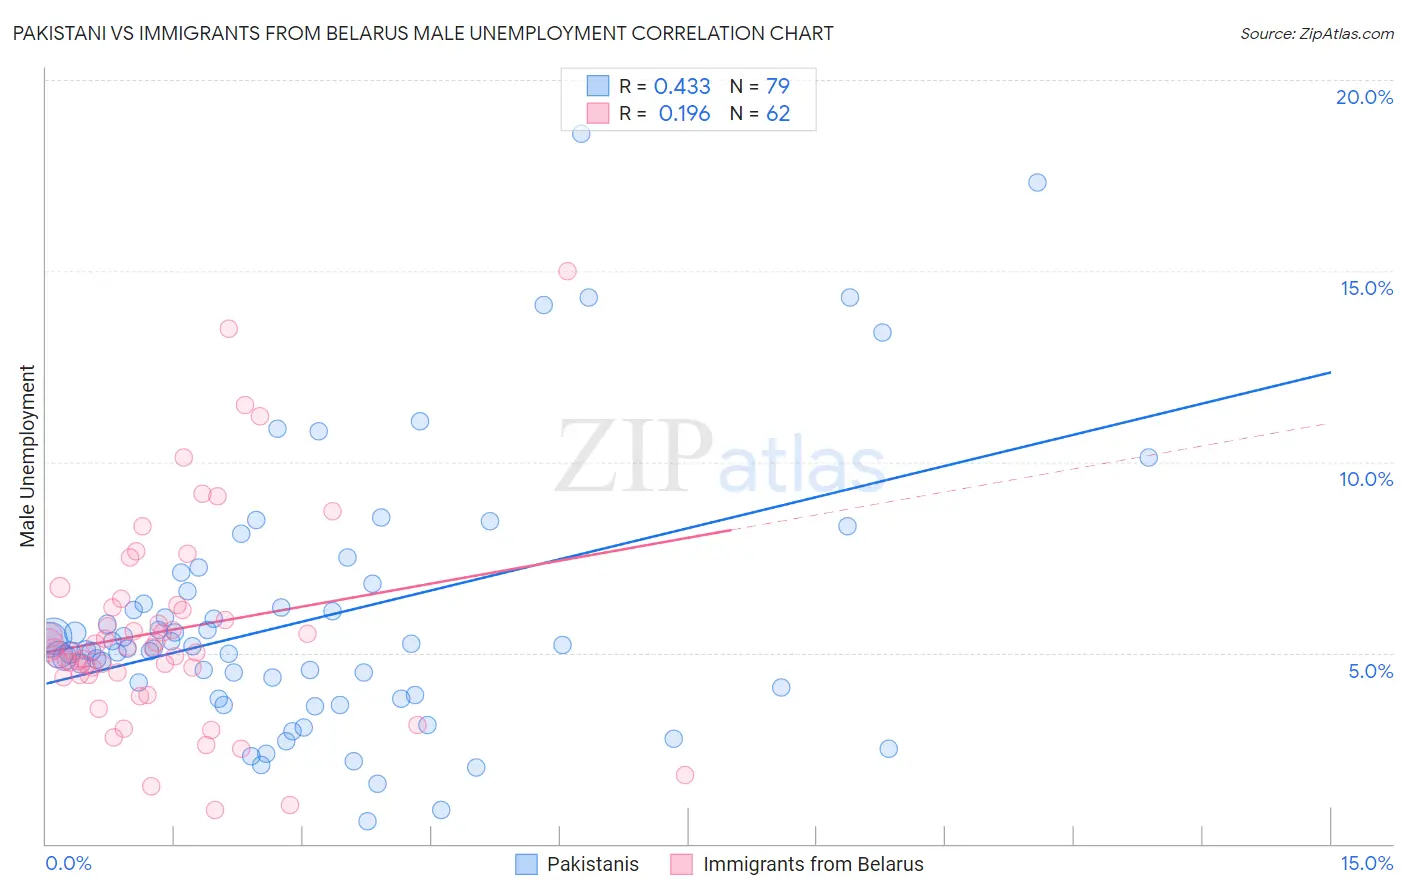
Pakistani vs Immigrants from Belarus Male Unemployment Correlation Chart
The statistical analysis conducted on geographies consisting of 334,491,221 people shows a moderate positive correlation between the proportion of Pakistanis and unemployment rate among males in the United States with a correlation coefficient (R) of 0.433 and weighted average of 5.2%. Similarly, the statistical analysis conducted on geographies consisting of 150,060,028 people shows a poor positive correlation between the proportion of Immigrants from Belarus and unemployment rate among males in the United States with a correlation coefficient (R) of 0.196 and weighted average of 5.4%, a difference of 3.7%.
Male Unemployment Correlation Summary
| Measurement | Pakistani | Immigrants from Belarus |
| Minimum | 0.60% | 0.90% |
| Maximum | 18.6% | 15.0% |
| Range | 18.0% | 14.1% |
| Mean | 5.9% | 5.6% |
| Median | 5.1% | 5.1% |
| Interquartile 25% (IQ1) | 3.9% | 4.4% |
| Interquartile 75% (IQ3) | 6.6% | 6.2% |
| Interquartile Range (IQR) | 2.7% | 1.8% |
| Standard Deviation (Sample) | 3.5% | 2.7% |
| Standard Deviation (Population) | 3.5% | 2.7% |
Similar Demographics by Male Unemployment
Demographics Similar to Pakistanis by Male Unemployment
In terms of male unemployment, the demographic groups most similar to Pakistanis are Immigrants from Saudi Arabia (5.2%, a difference of 0.030%), Lebanese (5.2%, a difference of 0.050%), Colombian (5.2%, a difference of 0.060%), Immigrants from Eastern Africa (5.2%, a difference of 0.060%), and Immigrants from Croatia (5.2%, a difference of 0.070%).
| Demographics | Rating | Rank | Male Unemployment |
| Immigrants | Brazil | 86.3 /100 | #127 | Excellent 5.2% |
| Hungarians | 85.1 /100 | #128 | Excellent 5.2% |
| Immigrants | Western Europe | 84.8 /100 | #129 | Excellent 5.2% |
| Immigrants | Malaysia | 83.5 /100 | #130 | Excellent 5.2% |
| Immigrants | Germany | 83.0 /100 | #131 | Excellent 5.2% |
| Chickasaw | 82.9 /100 | #132 | Excellent 5.2% |
| Colombians | 81.1 /100 | #133 | Excellent 5.2% |
| Pakistanis | 80.5 /100 | #134 | Excellent 5.2% |
| Immigrants | Saudi Arabia | 80.1 /100 | #135 | Excellent 5.2% |
| Lebanese | 79.9 /100 | #136 | Good 5.2% |
| Immigrants | Eastern Africa | 79.8 /100 | #137 | Good 5.2% |
| Immigrants | Croatia | 79.7 /100 | #138 | Good 5.2% |
| Kenyans | 79.4 /100 | #139 | Good 5.2% |
| Brazilians | 79.3 /100 | #140 | Good 5.2% |
| Immigrants | Switzerland | 79.2 /100 | #141 | Good 5.2% |
Demographics Similar to Immigrants from Belarus by Male Unemployment
In terms of male unemployment, the demographic groups most similar to Immigrants from Belarus are Immigrants from Israel (5.4%, a difference of 0.060%), Immigrants from South Eastern Asia (5.4%, a difference of 0.16%), Immigrants from Uganda (5.4%, a difference of 0.20%), Immigrants from South America (5.4%, a difference of 0.24%), and Arab (5.4%, a difference of 0.30%).
| Demographics | Rating | Rank | Male Unemployment |
| Koreans | 34.9 /100 | #185 | Fair 5.3% |
| Iraqis | 31.6 /100 | #186 | Fair 5.4% |
| Costa Ricans | 31.3 /100 | #187 | Fair 5.4% |
| Arabs | 30.2 /100 | #188 | Fair 5.4% |
| Immigrants | South America | 29.4 /100 | #189 | Fair 5.4% |
| Immigrants | Uganda | 28.8 /100 | #190 | Fair 5.4% |
| Immigrants | South Eastern Asia | 28.2 /100 | #191 | Fair 5.4% |
| Immigrants | Belarus | 26.0 /100 | #192 | Fair 5.4% |
| Immigrants | Israel | 25.2 /100 | #193 | Fair 5.4% |
| Spanish | 19.7 /100 | #194 | Poor 5.4% |
| Immigrants | Southern Europe | 17.7 /100 | #195 | Poor 5.4% |
| Albanians | 17.3 /100 | #196 | Poor 5.4% |
| Alsatians | 16.7 /100 | #197 | Poor 5.4% |
| Immigrants | Thailand | 14.7 /100 | #198 | Poor 5.4% |
| Immigrants | Greece | 14.5 /100 | #199 | Poor 5.4% |