Eastern European vs Trinidadian and Tobagonian Female Unemployment
COMPARE
Eastern European
Trinidadian and Tobagonian
Female Unemployment
Female Unemployment Comparison
Eastern Europeans
Trinidadians and Tobagonians
4.9%
FEMALE UNEMPLOYMENT
99.4/ 100
METRIC RATING
43rd/ 347
METRIC RANK
6.1%
FEMALE UNEMPLOYMENT
0.0/ 100
METRIC RATING
289th/ 347
METRIC RANK
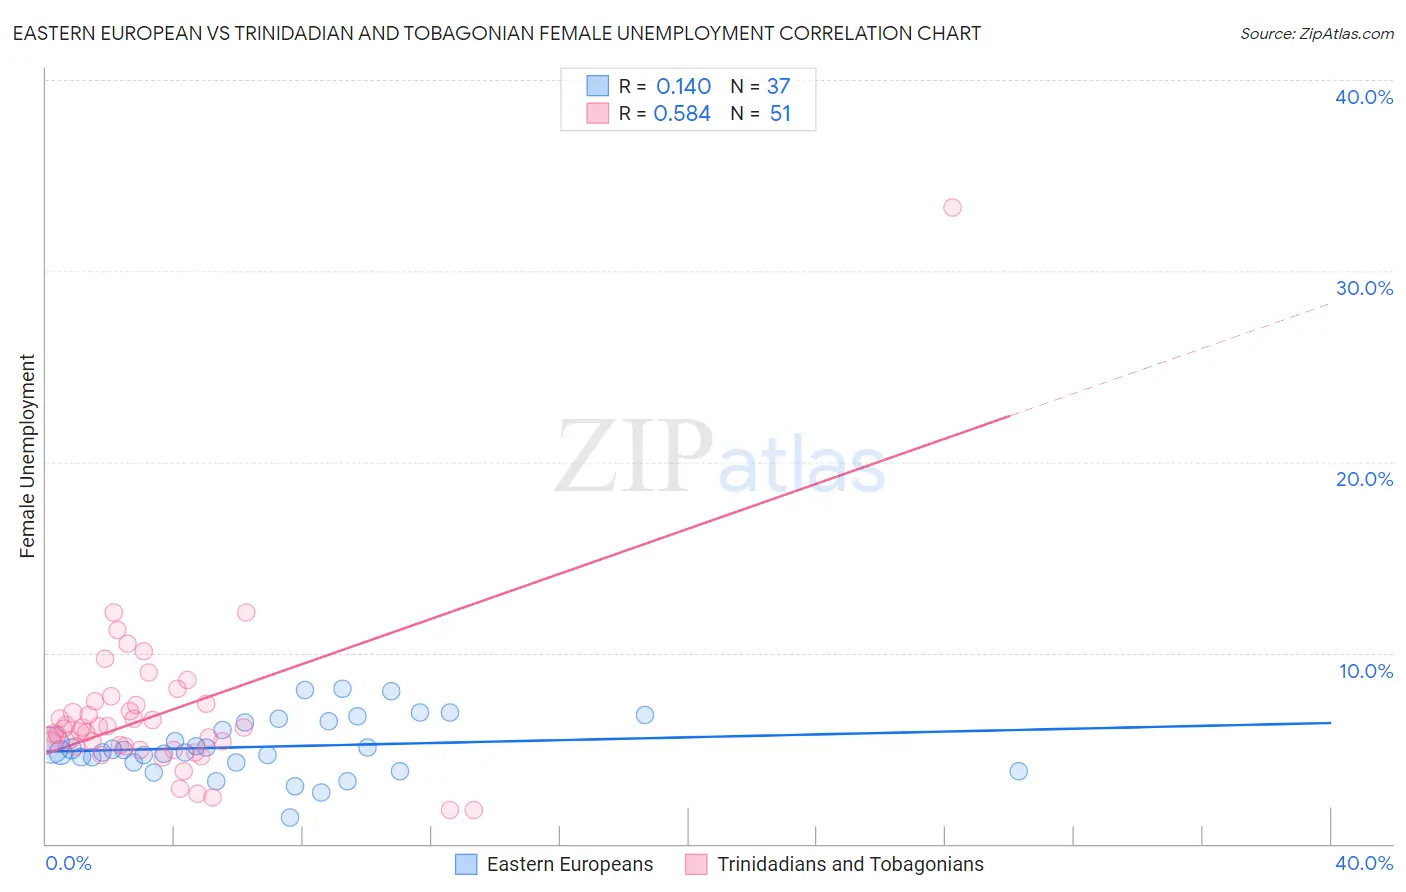
Eastern European vs Trinidadian and Tobagonian Female Unemployment Correlation Chart
The statistical analysis conducted on geographies consisting of 456,874,876 people shows a poor positive correlation between the proportion of Eastern Europeans and unemploymnet rate among females in the United States with a correlation coefficient (R) of 0.140 and weighted average of 4.9%. Similarly, the statistical analysis conducted on geographies consisting of 219,519,508 people shows a substantial positive correlation between the proportion of Trinidadians and Tobagonians and unemploymnet rate among females in the United States with a correlation coefficient (R) of 0.584 and weighted average of 6.1%, a difference of 25.5%.
Female Unemployment Correlation Summary
| Measurement | Eastern European | Trinidadian and Tobagonian |
| Minimum | 1.4% | 1.8% |
| Maximum | 8.1% | 33.3% |
| Range | 6.7% | 31.5% |
| Mean | 5.1% | 6.8% |
| Median | 4.9% | 6.0% |
| Interquartile 25% (IQ1) | 4.3% | 5.1% |
| Interquartile 75% (IQ3) | 6.4% | 7.3% |
| Interquartile Range (IQR) | 2.1% | 2.2% |
| Standard Deviation (Sample) | 1.5% | 4.4% |
| Standard Deviation (Population) | 1.5% | 4.4% |
Similar Demographics by Female Unemployment
Demographics Similar to Eastern Europeans by Female Unemployment
In terms of female unemployment, the demographic groups most similar to Eastern Europeans are Greek (4.9%, a difference of 0.11%), Italian (4.8%, a difference of 0.17%), Austrian (4.9%, a difference of 0.18%), Immigrants from Bulgaria (4.9%, a difference of 0.21%), and Okinawan (4.9%, a difference of 0.29%).
| Demographics | Rating | Rank | Female Unemployment |
| Yugoslavians | 99.7 /100 | #36 | Exceptional 4.8% |
| Pennsylvania Germans | 99.6 /100 | #37 | Exceptional 4.8% |
| Northern Europeans | 99.6 /100 | #38 | Exceptional 4.8% |
| Scotch-Irish | 99.6 /100 | #39 | Exceptional 4.8% |
| French | 99.6 /100 | #40 | Exceptional 4.8% |
| Tongans | 99.5 /100 | #41 | Exceptional 4.8% |
| Italians | 99.5 /100 | #42 | Exceptional 4.8% |
| Eastern Europeans | 99.4 /100 | #43 | Exceptional 4.9% |
| Greeks | 99.4 /100 | #44 | Exceptional 4.9% |
| Austrians | 99.3 /100 | #45 | Exceptional 4.9% |
| Immigrants | Bulgaria | 99.3 /100 | #46 | Exceptional 4.9% |
| Okinawans | 99.3 /100 | #47 | Exceptional 4.9% |
| Thais | 99.2 /100 | #48 | Exceptional 4.9% |
| Australians | 99.2 /100 | #49 | Exceptional 4.9% |
| Immigrants | Cuba | 99.1 /100 | #50 | Exceptional 4.9% |
Demographics Similar to Trinidadians and Tobagonians by Female Unemployment
In terms of female unemployment, the demographic groups most similar to Trinidadians and Tobagonians are Haitian (6.1%, a difference of 0.010%), Immigrants from Guatemala (6.1%, a difference of 0.050%), Immigrants from Caribbean (6.1%, a difference of 0.060%), Chippewa (6.1%, a difference of 0.080%), and Immigrants from Cabo Verde (6.1%, a difference of 0.11%).
| Demographics | Rating | Rank | Female Unemployment |
| Colville | 0.0 /100 | #282 | Tragic 6.0% |
| Salvadorans | 0.0 /100 | #283 | Tragic 6.0% |
| Immigrants | Senegal | 0.0 /100 | #284 | Tragic 6.1% |
| Immigrants | Cabo Verde | 0.0 /100 | #285 | Tragic 6.1% |
| Chippewa | 0.0 /100 | #286 | Tragic 6.1% |
| Immigrants | Guatemala | 0.0 /100 | #287 | Tragic 6.1% |
| Haitians | 0.0 /100 | #288 | Tragic 6.1% |
| Trinidadians and Tobagonians | 0.0 /100 | #289 | Tragic 6.1% |
| Immigrants | Caribbean | 0.0 /100 | #290 | Tragic 6.1% |
| Immigrants | West Indies | 0.0 /100 | #291 | Tragic 6.1% |
| Immigrants | Trinidad and Tobago | 0.0 /100 | #292 | Tragic 6.1% |
| Mexicans | 0.0 /100 | #293 | Tragic 6.1% |
| Immigrants | El Salvador | 0.0 /100 | #294 | Tragic 6.1% |
| Immigrants | Latin America | 0.0 /100 | #295 | Tragic 6.1% |
| Alaskan Athabascans | 0.0 /100 | #296 | Tragic 6.1% |