Alaska Native vs Native Hawaiian Female Unemployment
COMPARE
Alaska Native
Native Hawaiian
Female Unemployment
Female Unemployment Comparison
Alaska Natives
Native Hawaiians
6.6%
FEMALE UNEMPLOYMENT
0.0/ 100
METRIC RATING
327th/ 347
METRIC RANK
5.2%
FEMALE UNEMPLOYMENT
62.7/ 100
METRIC RATING
166th/ 347
METRIC RANK
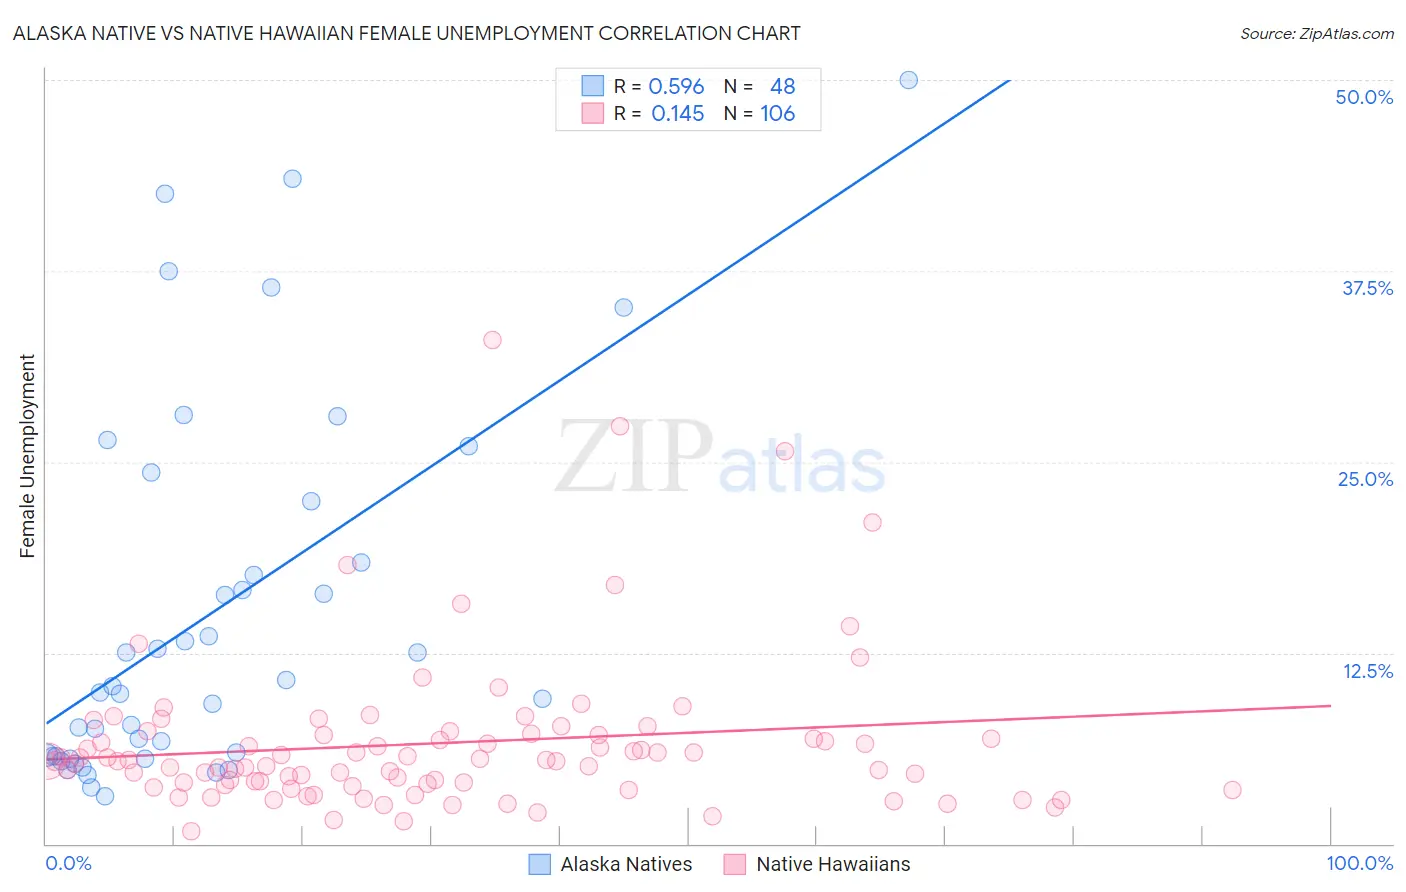
Alaska Native vs Native Hawaiian Female Unemployment Correlation Chart
The statistical analysis conducted on geographies consisting of 76,648,149 people shows a substantial positive correlation between the proportion of Alaska Natives and unemploymnet rate among females in the United States with a correlation coefficient (R) of 0.596 and weighted average of 6.6%. Similarly, the statistical analysis conducted on geographies consisting of 330,662,641 people shows a poor positive correlation between the proportion of Native Hawaiians and unemploymnet rate among females in the United States with a correlation coefficient (R) of 0.145 and weighted average of 5.2%, a difference of 27.1%.
Female Unemployment Correlation Summary
| Measurement | Alaska Native | Native Hawaiian |
| Minimum | 3.1% | 0.80% |
| Maximum | 50.0% | 33.0% |
| Range | 46.9% | 32.2% |
| Mean | 15.0% | 6.6% |
| Median | 10.1% | 5.4% |
| Interquartile 25% (IQ1) | 5.7% | 4.0% |
| Interquartile 75% (IQ3) | 20.4% | 7.1% |
| Interquartile Range (IQR) | 14.7% | 3.1% |
| Standard Deviation (Sample) | 12.1% | 5.1% |
| Standard Deviation (Population) | 12.0% | 5.1% |
Similar Demographics by Female Unemployment
Demographics Similar to Alaska Natives by Female Unemployment
In terms of female unemployment, the demographic groups most similar to Alaska Natives are Native/Alaskan (6.6%, a difference of 0.090%), Guyanese (6.7%, a difference of 0.44%), Apache (6.6%, a difference of 0.64%), Immigrants from Guyana (6.7%, a difference of 0.80%), and Cheyenne (6.6%, a difference of 0.91%).
| Demographics | Rating | Rank | Female Unemployment |
| Immigrants | Dominica | 0.0 /100 | #320 | Tragic 6.5% |
| Blacks/African Americans | 0.0 /100 | #321 | Tragic 6.5% |
| Vietnamese | 0.0 /100 | #322 | Tragic 6.5% |
| Immigrants | Belize | 0.0 /100 | #323 | Tragic 6.5% |
| Cheyenne | 0.0 /100 | #324 | Tragic 6.6% |
| Apache | 0.0 /100 | #325 | Tragic 6.6% |
| Natives/Alaskans | 0.0 /100 | #326 | Tragic 6.6% |
| Alaska Natives | 0.0 /100 | #327 | Tragic 6.6% |
| Guyanese | 0.0 /100 | #328 | Tragic 6.7% |
| Immigrants | Guyana | 0.0 /100 | #329 | Tragic 6.7% |
| Yakama | 0.0 /100 | #330 | Tragic 6.7% |
| Paiute | 0.0 /100 | #331 | Tragic 6.8% |
| Sioux | 0.0 /100 | #332 | Tragic 7.0% |
| Menominee | 0.0 /100 | #333 | Tragic 7.0% |
| Immigrants | Armenia | 0.0 /100 | #334 | Tragic 7.1% |
Demographics Similar to Native Hawaiians by Female Unemployment
In terms of female unemployment, the demographic groups most similar to Native Hawaiians are Syrian (5.2%, a difference of 0.0%), Immigrants from Thailand (5.2%, a difference of 0.040%), Immigrants from Asia (5.2%, a difference of 0.10%), Bangladeshi (5.2%, a difference of 0.10%), and Potawatomi (5.2%, a difference of 0.21%).
| Demographics | Rating | Rank | Female Unemployment |
| Immigrants | Micronesia | 66.9 /100 | #159 | Good 5.2% |
| Immigrants | Spain | 66.8 /100 | #160 | Good 5.2% |
| Immigrants | Pakistan | 66.7 /100 | #161 | Good 5.2% |
| Potawatomi | 65.9 /100 | #162 | Good 5.2% |
| Immigrants | Asia | 64.3 /100 | #163 | Good 5.2% |
| Bangladeshis | 64.3 /100 | #164 | Good 5.2% |
| Syrians | 62.8 /100 | #165 | Good 5.2% |
| Native Hawaiians | 62.7 /100 | #166 | Good 5.2% |
| Immigrants | Thailand | 62.1 /100 | #167 | Good 5.2% |
| Sri Lankans | 59.4 /100 | #168 | Average 5.2% |
| Immigrants | Chile | 59.0 /100 | #169 | Average 5.2% |
| Spanish | 55.9 /100 | #170 | Average 5.2% |
| Immigrants | Denmark | 55.0 /100 | #171 | Average 5.2% |
| Immigrants | Uganda | 50.7 /100 | #172 | Average 5.3% |
| Iranians | 50.4 /100 | #173 | Average 5.3% |