Zip Codes with the Largest Black / African American Community in Waxahachie, TX
RELATED REPORTS & OPTIONS
Black / African American
Waxahachie
Compare Zip Codes
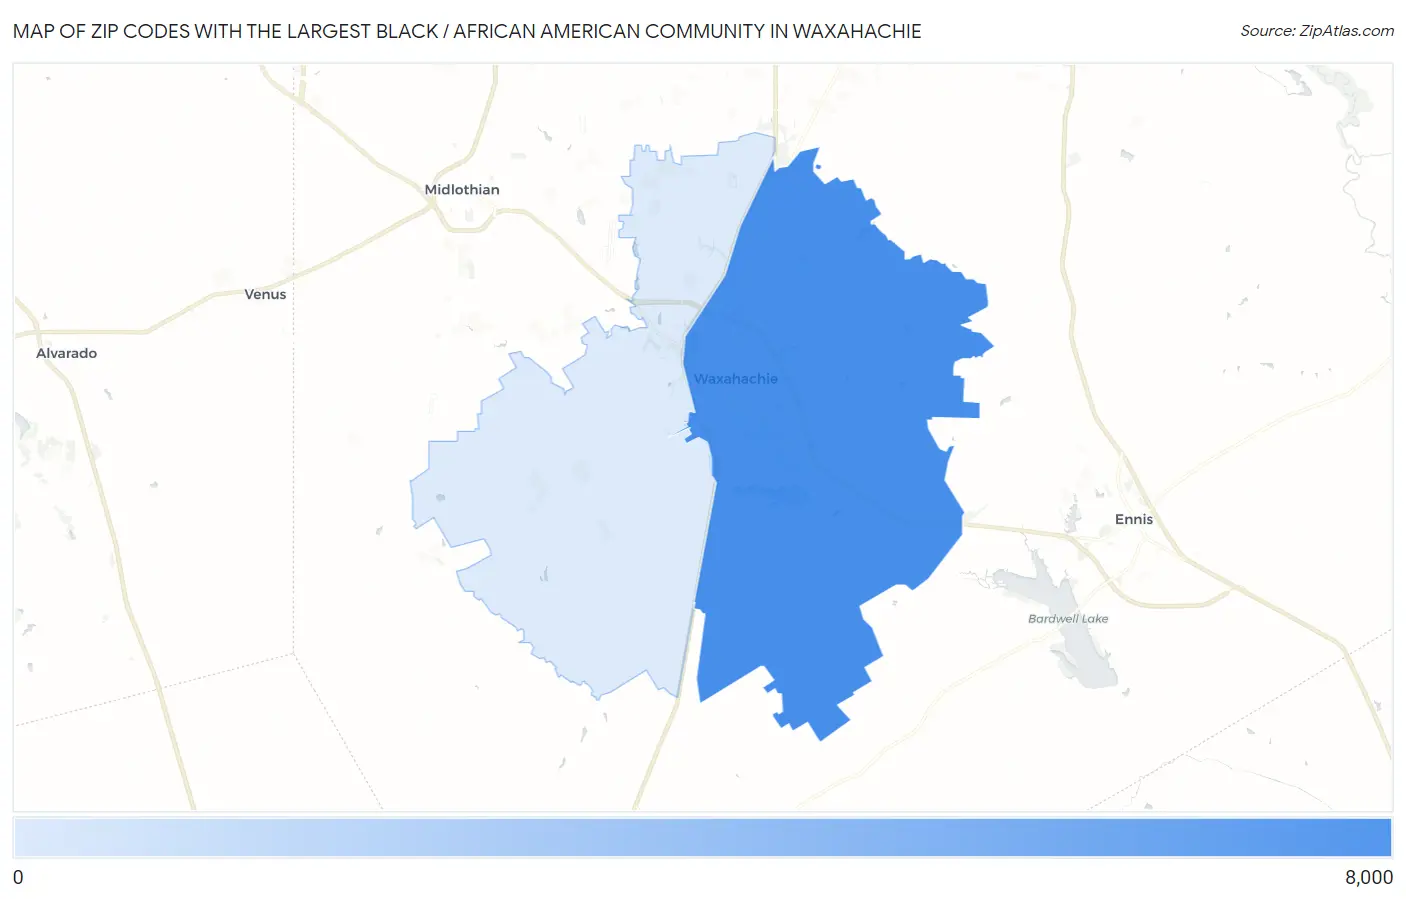
Map of Zip Codes with the Largest Black / African American Community in Waxahachie
1,196
7,203
Zip Codes with the Largest Black / African American Community in Waxahachie, TX
| Zip Code | Black / African American | vs State | vs National | |
| 1. | 75165 | 7,203 | 3,552,579(0.20%)#148 | 41,288,572(0.02%)#1,532 |
| 2. | 75167 | 1,196 | 3,552,579(0.03%)#567 | 41,288,572(0.00%)#6,238 |
1
Common Questions
What are the Top Zip Codes with the Largest Black / African American Community in Waxahachie, TX?
Top Zip Codes with the Largest Black / African American Community in Waxahachie, TX are:
What zip code has the Largest Black / African American Community in Waxahachie, TX?
75165 has the Largest Black / African American Community in Waxahachie, TX with 7,203.
What is the Total Black / African American Population in Waxahachie, TX?
Total Black / African American Population in Waxahachie is 7,112.
What is the Total Black / African American Population in Texas?
Total Black / African American Population in Texas is 3,552,579.
What is the Total Black / African American Population in the United States?
Total Black / African American Population in the United States is 41,288,572.