Zip Codes with the Highest Percentage of Population Employed in Professional & Scientific Services in Richardson, TX

RELATED REPORTS & OPTIONS

Professional & Scientific Services
Population
Families and Households
Female Fertility
Female Fertility (Unmarried)
Race (Community Size)
Race (Percentage)
Ancestry (Community Size)
AfghanAfricanAmericanApacheArabArgentineanArmenianAustrianBelgianBhutaneseBlackfeetBrazilianBritishBulgarianBurmeseCanadianCelticCentral AmericanCentral American IndianCherokeeChileanChoctawColombianCreekCroatianCubanCzechCzechoslovakianDanishDominicanDutchEastern EuropeanEcuadorianEgyptianEnglishEthiopianEuropeanFilipinoFinnishFrenchFrench CanadianGermanGhanaianGreekGuatemalanHaitianHonduranHungarianIndian (Asian)IranianIraqiIrishIsraeliItalianJamaicanJapaneseJordanianKoreanLaotianLatvianLebaneseLithuanianMexicanMexican American IndianMongolianMoroccanNative HawaiianNigerianNorthern EuropeanNorwegianPakistaniPalestinianPanamanianPeruvianPolishPortuguesePotawatomiPuerto RicanRomanianRussianSalvadoranScandinavianScotch-IrishScottishSlavicSlovakSloveneSouth AfricanSouth AmericanSpaniardSpanishSri LankanSubsaharan AfricanSwedishSwissSyrianThaiTrinidadian and TobagonianTurkishUkrainianVenezuelanVietnameseWelsh
Ancestry (Percentage)
AfghanAfricanAmericanApacheArabArgentineanArmenianAustrianBelgianBhutaneseBlackfeetBrazilianBritishBulgarianBurmeseCanadianCelticCentral AmericanCentral American IndianCherokeeChileanChoctawColombianCreekCroatianCubanCzechCzechoslovakianDanishDominicanDutchEastern EuropeanEcuadorianEgyptianEnglishEthiopianEuropeanFilipinoFinnishFrenchFrench CanadianGermanGhanaianGreekGuatemalanHaitianHonduranHungarianIndian (Asian)IranianIraqiIrishIsraeliItalianJamaicanJapaneseJordanianKoreanLaotianLatvianLebaneseLithuanianMexicanMexican American IndianMongolianMoroccanNative HawaiianNigerianNorthern EuropeanNorwegianPakistaniPalestinianPanamanianPeruvianPolishPortuguesePotawatomiPuerto RicanRomanianRussianSalvadoranScandinavianScotch-IrishScottishSlavicSlovakSloveneSouth AfricanSouth AmericanSpaniardSpanishSri LankanSubsaharan AfricanSwedishSwissSyrianThaiTrinidadian and TobagonianTurkishUkrainianVenezuelanVietnameseWelsh
Immigrant Origin (Total)
Immigrant Origin (Percentage)
Income
Income (Families)
Income (Households)
Poverty
Poverty (Families)
Unemployment
Employment Occupations
Employment Industries
Employer Class
Commute Time
Commute Means
School Enrollment
Education by Degree Field
Occupancy
Finances
Physical Characteristics
Richardson
Compare Zip Codes
Comparison Subject

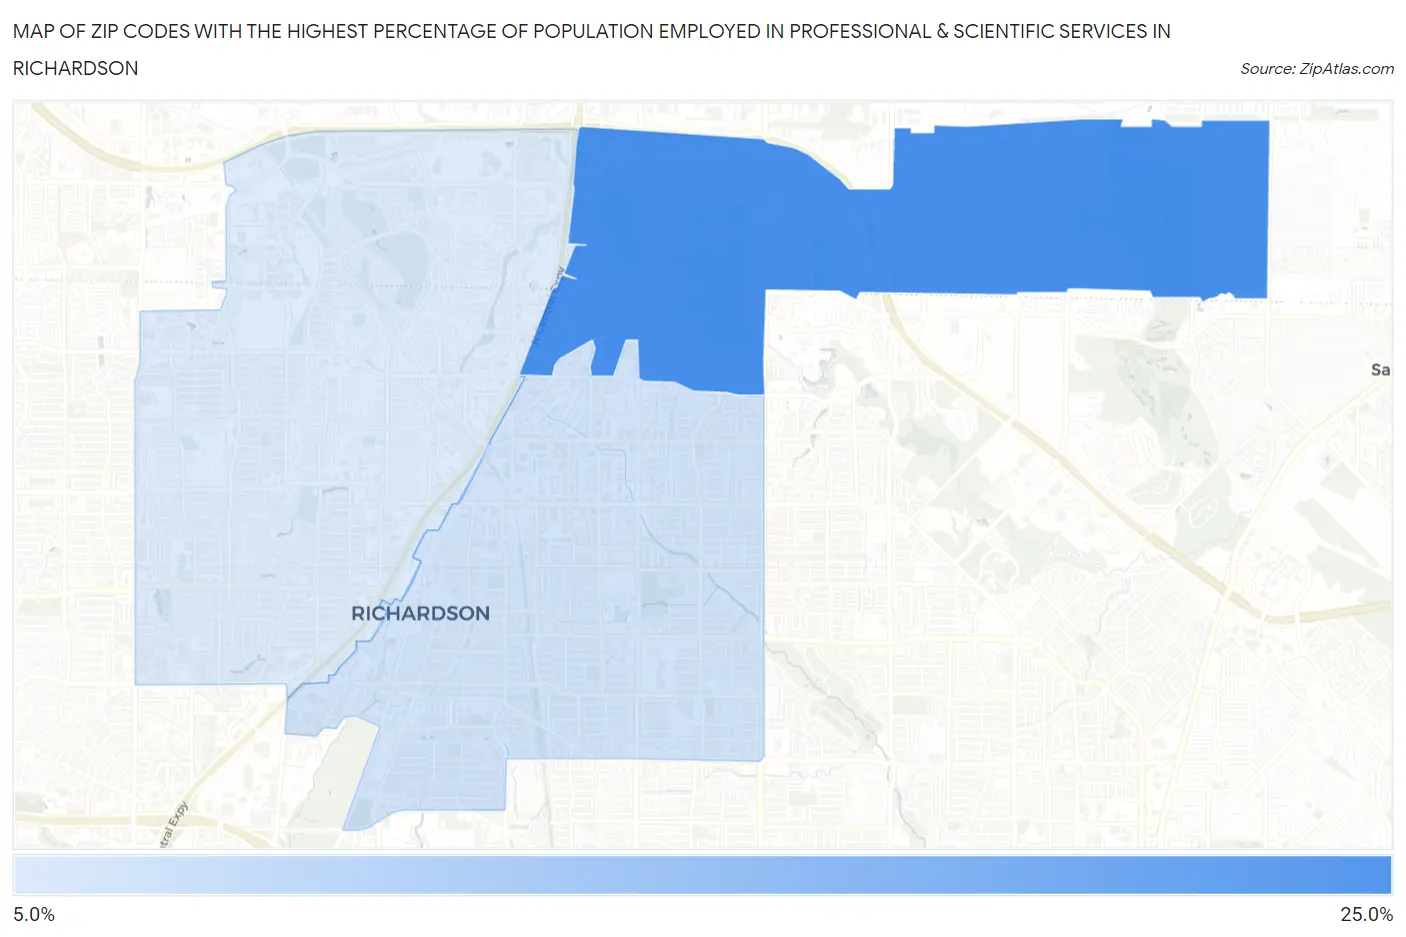
Map of Zip Codes with the Highest Percentage of Population Employed in Professional & Scientific Services in Richardson

0.0%
25.0%
Zip Codes with the Highest Percentage of Population Employed in Professional & Scientific Services in Richardson Map

Zip Codes with the Highest Percentage of Population Employed in Professional & Scientific Services in Richardson, TX

Zip Code % Employed vs State vs National
1.7508222.7%7.6%(+15.1)#277.8%(+14.9)#601
2.7508113.0%7.6%(+5.45)#1627.8%(+5.20)#2,694
3.7508012.3%7.6%(+4.69)#1697.8%(+4.44)#3,042

Common Questions

What are the Top Zip Codes with the Highest Percentage of Population Employed in Professional & Scientific Services in Richardson, TX?
Top Zip Codes with the Highest Percentage of Population Employed in Professional & Scientific Services in Richardson, TX are:
#1
22.7%
#2
13.0%
#3
12.3%
What zip code has the Highest Percentage of Population Employed in Professional & Scientific Services in Richardson, TX?
75082 has the Highest Percentage of Population Employed in Professional & Scientific Services in Richardson, TX with 22.7%.
What is the Percentage of Population Employed in Professional & Scientific Services in Richardson, TX?
Percentage of Population Employed in Professional & Scientific Services in Richardson is 15.4%.
What is the Percentage of Population Employed in Professional & Scientific Services in Texas?
Percentage of Population Employed in Professional & Scientific Services in Texas is 7.6%.
What is the Percentage of Population Employed in Professional & Scientific Services in the United States?
Percentage of Population Employed in Professional & Scientific Services in the United States is 7.8%.