Zimbabwean vs Hawaiian Child Poverty Under the Age of 5
COMPARE
Zimbabwean
Hawaiian
Child Poverty Under the Age of 5
Child Poverty Under the Age of 5 Comparison
Zimbabweans
Hawaiians
15.2%
CHILD POVERTY UNDER THE AGE OF 5
99.0/ 100
METRIC RATING
68th/ 347
METRIC RANK
17.4%
CHILD POVERTY UNDER THE AGE OF 5
41.5/ 100
METRIC RATING
179th/ 347
METRIC RANK
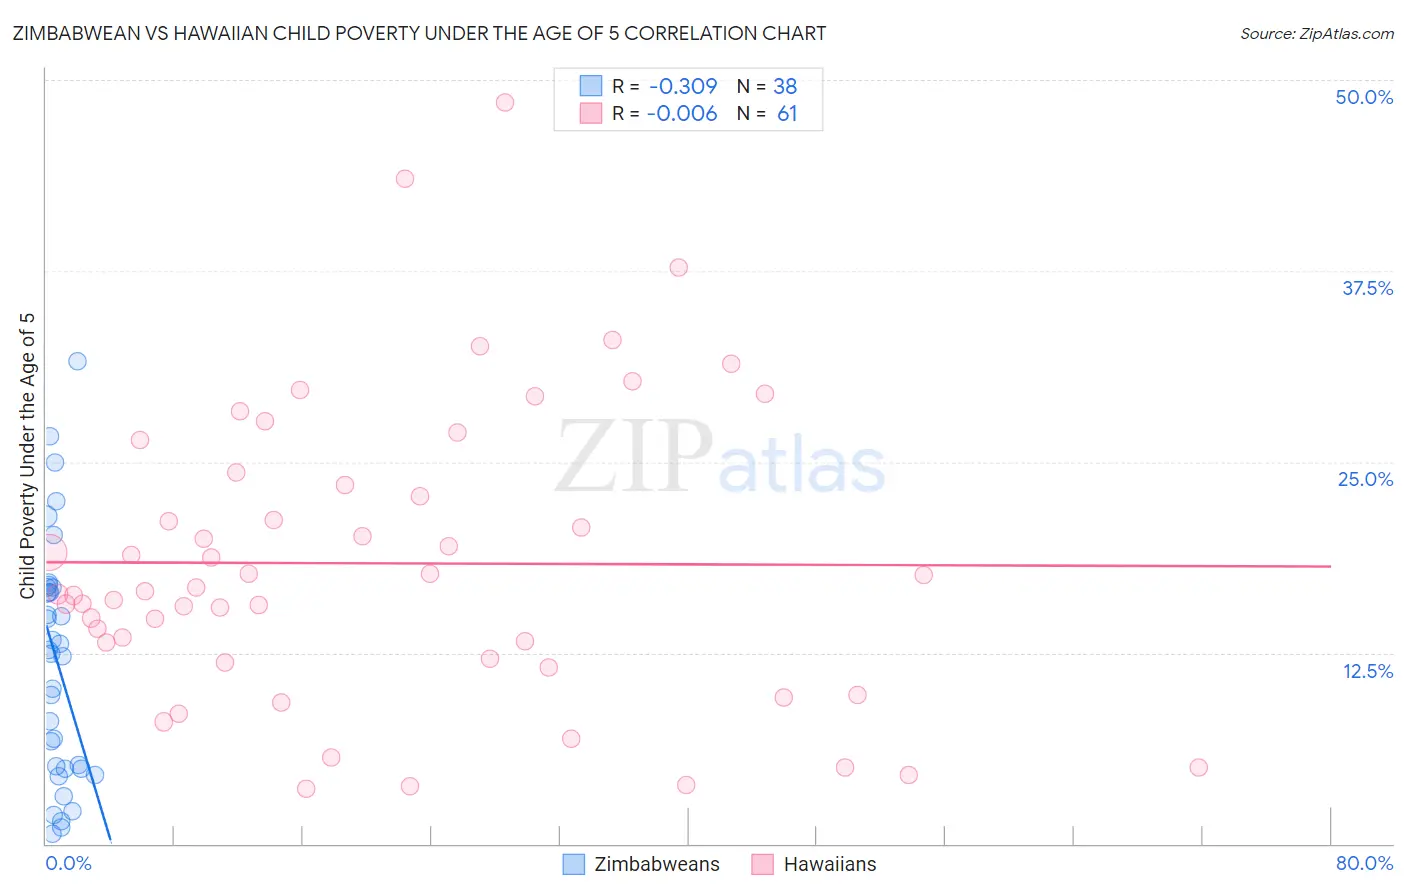
Zimbabwean vs Hawaiian Child Poverty Under the Age of 5 Correlation Chart
The statistical analysis conducted on geographies consisting of 68,606,248 people shows a mild negative correlation between the proportion of Zimbabweans and poverty level among children under the age of 5 in the United States with a correlation coefficient (R) of -0.309 and weighted average of 15.2%. Similarly, the statistical analysis conducted on geographies consisting of 319,559,583 people shows no correlation between the proportion of Hawaiians and poverty level among children under the age of 5 in the United States with a correlation coefficient (R) of -0.006 and weighted average of 17.4%, a difference of 14.5%.
Child Poverty Under the Age of 5 Correlation Summary
| Measurement | Zimbabwean | Hawaiian |
| Minimum | 0.66% | 3.6% |
| Maximum | 31.6% | 48.5% |
| Range | 31.0% | 44.9% |
| Mean | 11.9% | 18.4% |
| Median | 12.5% | 16.6% |
| Interquartile 25% (IQ1) | 4.9% | 12.0% |
| Interquartile 75% (IQ3) | 16.8% | 23.9% |
| Interquartile Range (IQR) | 11.9% | 11.9% |
| Standard Deviation (Sample) | 7.8% | 9.7% |
| Standard Deviation (Population) | 7.7% | 9.7% |
Similar Demographics by Child Poverty Under the Age of 5
Demographics Similar to Zimbabweans by Child Poverty Under the Age of 5
In terms of child poverty under the age of 5, the demographic groups most similar to Zimbabweans are Greek (15.2%, a difference of 0.0%), Lithuanian (15.2%, a difference of 0.010%), Immigrants from Scotland (15.2%, a difference of 0.070%), Immigrants from Fiji (15.2%, a difference of 0.18%), and Immigrants from Romania (15.2%, a difference of 0.21%).
| Demographics | Rating | Rank | Child Poverty Under the Age of 5 |
| Immigrants | Poland | 99.1 /100 | #61 | Exceptional 15.1% |
| Immigrants | Eastern Europe | 99.1 /100 | #62 | Exceptional 15.1% |
| Immigrants | Europe | 99.1 /100 | #63 | Exceptional 15.1% |
| Immigrants | Romania | 99.1 /100 | #64 | Exceptional 15.2% |
| Immigrants | Fiji | 99.0 /100 | #65 | Exceptional 15.2% |
| Immigrants | Scotland | 99.0 /100 | #66 | Exceptional 15.2% |
| Greeks | 99.0 /100 | #67 | Exceptional 15.2% |
| Zimbabweans | 99.0 /100 | #68 | Exceptional 15.2% |
| Lithuanians | 99.0 /100 | #69 | Exceptional 15.2% |
| Immigrants | Belgium | 98.8 /100 | #70 | Exceptional 15.3% |
| Immigrants | Egypt | 98.8 /100 | #71 | Exceptional 15.3% |
| Immigrants | Sweden | 98.8 /100 | #72 | Exceptional 15.3% |
| Immigrants | Ukraine | 98.7 /100 | #73 | Exceptional 15.3% |
| Argentineans | 98.5 /100 | #74 | Exceptional 15.4% |
| Immigrants | Argentina | 98.5 /100 | #75 | Exceptional 15.4% |
Demographics Similar to Hawaiians by Child Poverty Under the Age of 5
In terms of child poverty under the age of 5, the demographic groups most similar to Hawaiians are South American Indian (17.4%, a difference of 0.010%), Immigrants from Germany (17.4%, a difference of 0.050%), Arab (17.4%, a difference of 0.080%), Lebanese (17.4%, a difference of 0.12%), and Immigrants from Cameroon (17.4%, a difference of 0.13%).
| Demographics | Rating | Rank | Child Poverty Under the Age of 5 |
| Yugoslavians | 54.1 /100 | #172 | Average 17.2% |
| Welsh | 54.0 /100 | #173 | Average 17.2% |
| Immigrants | Saudi Arabia | 50.0 /100 | #174 | Average 17.2% |
| Immigrants | Lebanon | 47.6 /100 | #175 | Average 17.3% |
| Immigrants | Iraq | 45.2 /100 | #176 | Average 17.3% |
| Immigrants | Sierra Leone | 43.6 /100 | #177 | Average 17.3% |
| Immigrants | Cameroon | 42.7 /100 | #178 | Average 17.4% |
| Hawaiians | 41.5 /100 | #179 | Average 17.4% |
| South American Indians | 41.4 /100 | #180 | Average 17.4% |
| Immigrants | Germany | 41.0 /100 | #181 | Average 17.4% |
| Arabs | 40.7 /100 | #182 | Average 17.4% |
| Lebanese | 40.3 /100 | #183 | Average 17.4% |
| Immigrants | Costa Rica | 39.0 /100 | #184 | Fair 17.4% |
| Immigrants | Armenia | 38.0 /100 | #185 | Fair 17.5% |
| Immigrants | Bosnia and Herzegovina | 35.0 /100 | #186 | Fair 17.5% |