Zimbabwean vs French Family Poverty
COMPARE
Zimbabwean
French
Family Poverty
Family Poverty Comparison
Zimbabweans
French
7.8%
FAMILY POVERTY
98.4/ 100
METRIC RATING
63rd/ 347
METRIC RANK
8.3%
FAMILY POVERTY
92.8/ 100
METRIC RATING
119th/ 347
METRIC RANK
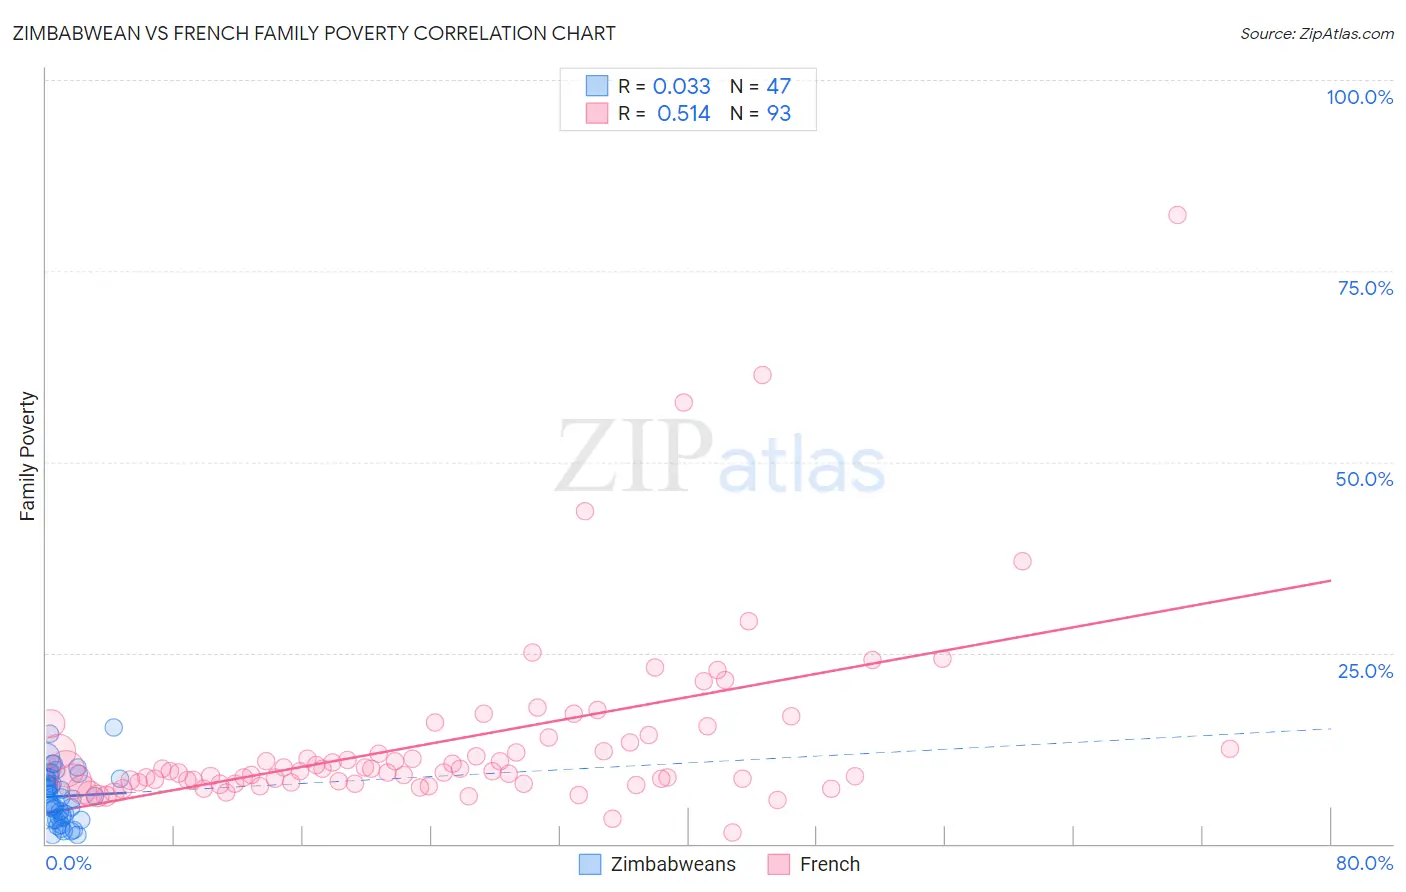
Zimbabwean vs French Family Poverty Correlation Chart
The statistical analysis conducted on geographies consisting of 69,162,841 people shows no correlation between the proportion of Zimbabweans and poverty level among families in the United States with a correlation coefficient (R) of 0.033 and weighted average of 7.8%. Similarly, the statistical analysis conducted on geographies consisting of 567,554,801 people shows a substantial positive correlation between the proportion of French and poverty level among families in the United States with a correlation coefficient (R) of 0.514 and weighted average of 8.3%, a difference of 5.8%.
Family Poverty Correlation Summary
| Measurement | Zimbabwean | French |
| Minimum | 1.2% | 1.5% |
| Maximum | 15.3% | 82.4% |
| Range | 14.0% | 80.9% |
| Mean | 6.2% | 13.4% |
| Median | 6.1% | 9.6% |
| Interquartile 25% (IQ1) | 3.5% | 8.0% |
| Interquartile 75% (IQ3) | 8.6% | 13.6% |
| Interquartile Range (IQR) | 5.1% | 5.6% |
| Standard Deviation (Sample) | 3.4% | 12.0% |
| Standard Deviation (Population) | 3.4% | 11.9% |
Similar Demographics by Family Poverty
Demographics Similar to Zimbabweans by Family Poverty
In terms of family poverty, the demographic groups most similar to Zimbabweans are Korean (7.8%, a difference of 0.15%), Immigrants from Bulgaria (7.8%, a difference of 0.16%), Dutch (7.8%, a difference of 0.22%), Northern European (7.8%, a difference of 0.23%), and Australian (7.8%, a difference of 0.27%).
| Demographics | Rating | Rank | Family Poverty |
| Immigrants | Serbia | 98.7 /100 | #56 | Exceptional 7.7% |
| Asians | 98.7 /100 | #57 | Exceptional 7.7% |
| Finns | 98.7 /100 | #58 | Exceptional 7.7% |
| Europeans | 98.7 /100 | #59 | Exceptional 7.7% |
| Immigrants | Greece | 98.7 /100 | #60 | Exceptional 7.7% |
| Immigrants | Netherlands | 98.6 /100 | #61 | Exceptional 7.7% |
| Macedonians | 98.6 /100 | #62 | Exceptional 7.8% |
| Zimbabweans | 98.4 /100 | #63 | Exceptional 7.8% |
| Koreans | 98.3 /100 | #64 | Exceptional 7.8% |
| Immigrants | Bulgaria | 98.3 /100 | #65 | Exceptional 7.8% |
| Dutch | 98.3 /100 | #66 | Exceptional 7.8% |
| Northern Europeans | 98.3 /100 | #67 | Exceptional 7.8% |
| Australians | 98.2 /100 | #68 | Exceptional 7.8% |
| Immigrants | Belgium | 98.2 /100 | #69 | Exceptional 7.8% |
| Immigrants | Canada | 98.2 /100 | #70 | Exceptional 7.8% |
Demographics Similar to French by Family Poverty
In terms of family poverty, the demographic groups most similar to French are Immigrants from Western Europe (8.2%, a difference of 0.070%), Immigrants from Russia (8.2%, a difference of 0.26%), South African (8.2%, a difference of 0.33%), Immigrants from Israel (8.2%, a difference of 0.39%), and Immigrants from Egypt (8.3%, a difference of 0.56%).
| Demographics | Rating | Rank | Family Poverty |
| Immigrants | France | 94.4 /100 | #112 | Exceptional 8.2% |
| Canadians | 94.2 /100 | #113 | Exceptional 8.2% |
| Immigrants | Zimbabwe | 94.0 /100 | #114 | Exceptional 8.2% |
| Immigrants | Israel | 93.5 /100 | #115 | Exceptional 8.2% |
| South Africans | 93.4 /100 | #116 | Exceptional 8.2% |
| Immigrants | Russia | 93.2 /100 | #117 | Exceptional 8.2% |
| Immigrants | Western Europe | 92.9 /100 | #118 | Exceptional 8.2% |
| French | 92.8 /100 | #119 | Exceptional 8.3% |
| Immigrants | Egypt | 91.6 /100 | #120 | Exceptional 8.3% |
| Native Hawaiians | 91.3 /100 | #121 | Exceptional 8.3% |
| Paraguayans | 91.2 /100 | #122 | Exceptional 8.3% |
| Palestinians | 91.1 /100 | #123 | Exceptional 8.3% |
| Soviet Union | 90.8 /100 | #124 | Exceptional 8.3% |
| Pakistanis | 90.8 /100 | #125 | Exceptional 8.3% |
| Icelanders | 90.3 /100 | #126 | Exceptional 8.3% |