Immigrants from Uganda vs French Family Poverty
COMPARE
Immigrants from Uganda
French
Family Poverty
Family Poverty Comparison
Immigrants from Uganda
French
9.1%
FAMILY POVERTY
43.4/ 100
METRIC RATING
180th/ 347
METRIC RANK
8.3%
FAMILY POVERTY
92.8/ 100
METRIC RATING
119th/ 347
METRIC RANK
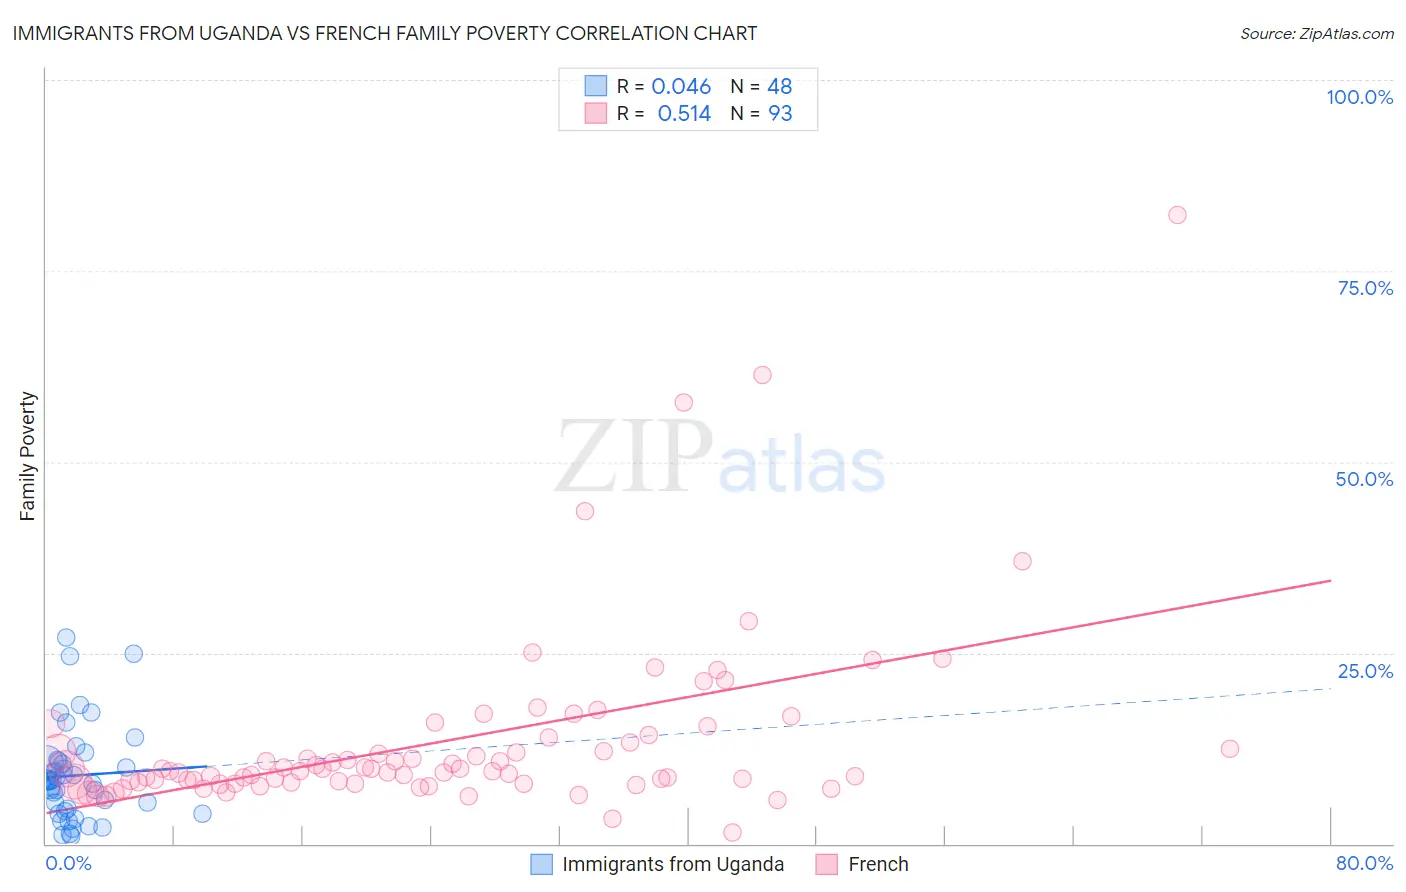
Immigrants from Uganda vs French Family Poverty Correlation Chart
The statistical analysis conducted on geographies consisting of 125,892,815 people shows no correlation between the proportion of Immigrants from Uganda and poverty level among families in the United States with a correlation coefficient (R) of 0.046 and weighted average of 9.1%. Similarly, the statistical analysis conducted on geographies consisting of 567,554,801 people shows a substantial positive correlation between the proportion of French and poverty level among families in the United States with a correlation coefficient (R) of 0.514 and weighted average of 8.3%, a difference of 10.1%.
Family Poverty Correlation Summary
| Measurement | Immigrants from Uganda | French |
| Minimum | 1.0% | 1.5% |
| Maximum | 27.0% | 82.4% |
| Range | 26.0% | 80.9% |
| Mean | 8.9% | 13.4% |
| Median | 8.3% | 9.6% |
| Interquartile 25% (IQ1) | 4.5% | 8.0% |
| Interquartile 75% (IQ3) | 10.7% | 13.6% |
| Interquartile Range (IQR) | 6.3% | 5.6% |
| Standard Deviation (Sample) | 6.1% | 12.0% |
| Standard Deviation (Population) | 6.0% | 11.9% |
Similar Demographics by Family Poverty
Demographics Similar to Immigrants from Uganda by Family Poverty
In terms of family poverty, the demographic groups most similar to Immigrants from Uganda are Immigrants from Iraq (9.1%, a difference of 0.13%), Hmong (9.1%, a difference of 0.43%), Immigrants from Morocco (9.1%, a difference of 0.43%), Immigrants from Cameroon (9.0%, a difference of 0.49%), and Hawaiian (9.0%, a difference of 0.50%).
| Demographics | Rating | Rank | Family Poverty |
| Immigrants | Fiji | 56.4 /100 | #173 | Average 8.9% |
| Immigrants | Albania | 50.0 /100 | #174 | Average 9.0% |
| Costa Ricans | 49.3 /100 | #175 | Average 9.0% |
| Immigrants | Syria | 47.5 /100 | #176 | Average 9.0% |
| Hawaiians | 47.2 /100 | #177 | Average 9.0% |
| Immigrants | Cameroon | 47.1 /100 | #178 | Average 9.0% |
| Immigrants | Iraq | 44.4 /100 | #179 | Average 9.1% |
| Immigrants | Uganda | 43.4 /100 | #180 | Average 9.1% |
| Hmong | 40.2 /100 | #181 | Average 9.1% |
| Immigrants | Morocco | 40.2 /100 | #182 | Average 9.1% |
| Uruguayans | 39.2 /100 | #183 | Fair 9.1% |
| South American Indians | 38.7 /100 | #184 | Fair 9.1% |
| Immigrants | Saudi Arabia | 38.6 /100 | #185 | Fair 9.1% |
| Colombians | 36.1 /100 | #186 | Fair 9.2% |
| Delaware | 35.4 /100 | #187 | Fair 9.2% |
Demographics Similar to French by Family Poverty
In terms of family poverty, the demographic groups most similar to French are Immigrants from Western Europe (8.2%, a difference of 0.070%), Immigrants from Russia (8.2%, a difference of 0.26%), South African (8.2%, a difference of 0.33%), Immigrants from Israel (8.2%, a difference of 0.39%), and Immigrants from Egypt (8.3%, a difference of 0.56%).
| Demographics | Rating | Rank | Family Poverty |
| Immigrants | France | 94.4 /100 | #112 | Exceptional 8.2% |
| Canadians | 94.2 /100 | #113 | Exceptional 8.2% |
| Immigrants | Zimbabwe | 94.0 /100 | #114 | Exceptional 8.2% |
| Immigrants | Israel | 93.5 /100 | #115 | Exceptional 8.2% |
| South Africans | 93.4 /100 | #116 | Exceptional 8.2% |
| Immigrants | Russia | 93.2 /100 | #117 | Exceptional 8.2% |
| Immigrants | Western Europe | 92.9 /100 | #118 | Exceptional 8.2% |
| French | 92.8 /100 | #119 | Exceptional 8.3% |
| Immigrants | Egypt | 91.6 /100 | #120 | Exceptional 8.3% |
| Native Hawaiians | 91.3 /100 | #121 | Exceptional 8.3% |
| Paraguayans | 91.2 /100 | #122 | Exceptional 8.3% |
| Palestinians | 91.1 /100 | #123 | Exceptional 8.3% |
| Soviet Union | 90.8 /100 | #124 | Exceptional 8.3% |
| Pakistanis | 90.8 /100 | #125 | Exceptional 8.3% |
| Icelanders | 90.3 /100 | #126 | Exceptional 8.3% |