Choctaw vs French Family Poverty
COMPARE
Choctaw
French
Family Poverty
Family Poverty Comparison
Choctaw
French
11.6%
FAMILY POVERTY
0.0/ 100
METRIC RATING
296th/ 347
METRIC RANK
8.3%
FAMILY POVERTY
92.8/ 100
METRIC RATING
119th/ 347
METRIC RANK
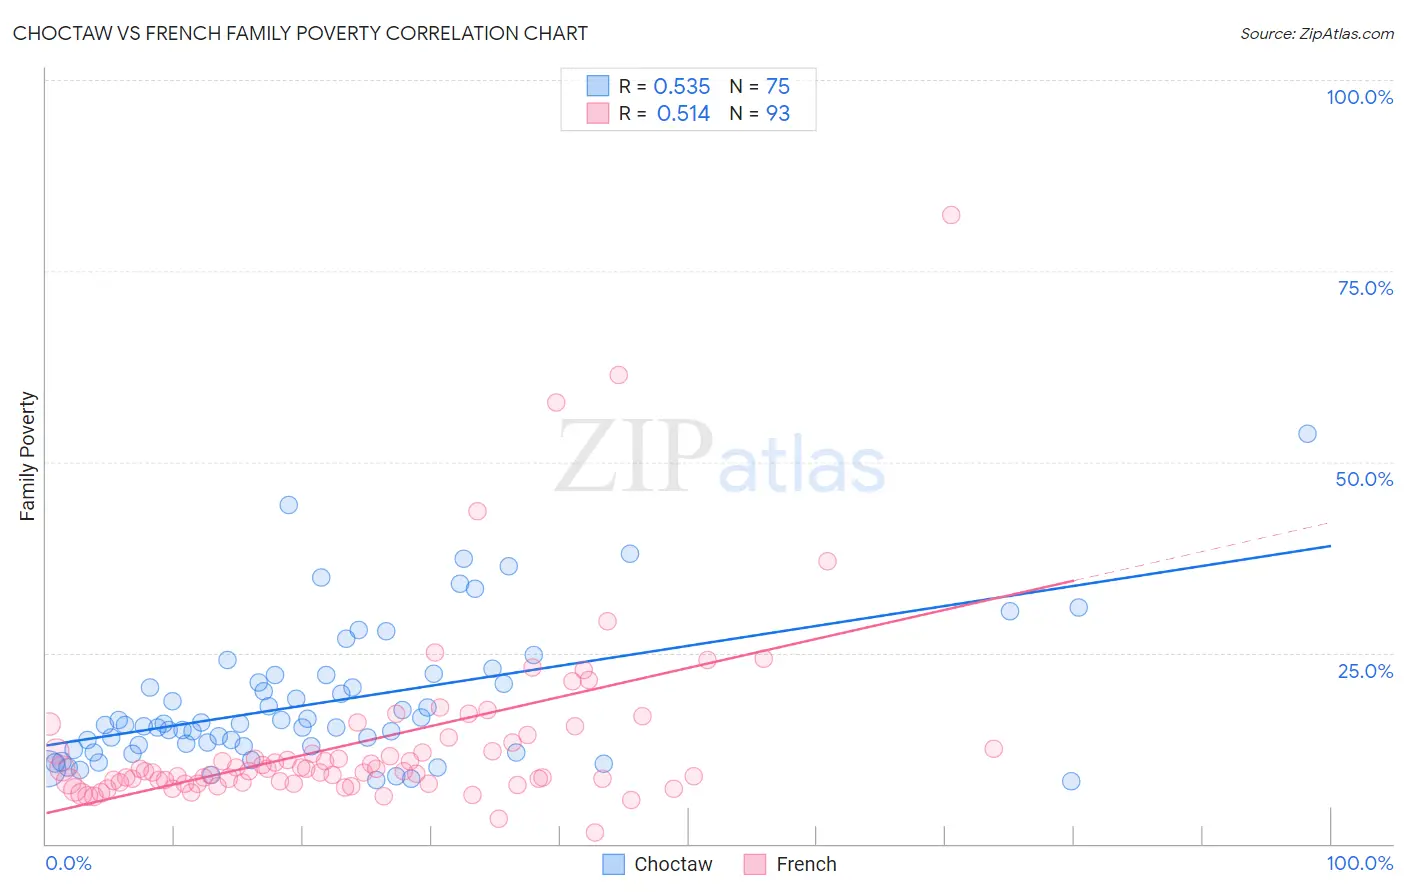
Choctaw vs French Family Poverty Correlation Chart
The statistical analysis conducted on geographies consisting of 269,406,006 people shows a substantial positive correlation between the proportion of Choctaw and poverty level among families in the United States with a correlation coefficient (R) of 0.535 and weighted average of 11.6%. Similarly, the statistical analysis conducted on geographies consisting of 567,554,801 people shows a substantial positive correlation between the proportion of French and poverty level among families in the United States with a correlation coefficient (R) of 0.514 and weighted average of 8.3%, a difference of 40.8%.
Family Poverty Correlation Summary
| Measurement | Choctaw | French |
| Minimum | 8.2% | 1.5% |
| Maximum | 53.6% | 82.4% |
| Range | 45.4% | 80.9% |
| Mean | 18.5% | 13.4% |
| Median | 15.6% | 9.6% |
| Interquartile 25% (IQ1) | 12.7% | 8.0% |
| Interquartile 75% (IQ3) | 22.1% | 13.6% |
| Interquartile Range (IQR) | 9.3% | 5.6% |
| Standard Deviation (Sample) | 9.0% | 12.0% |
| Standard Deviation (Population) | 9.0% | 11.9% |
Similar Demographics by Family Poverty
Demographics Similar to Choctaw by Family Poverty
In terms of family poverty, the demographic groups most similar to Choctaw are Immigrants from Haiti (11.6%, a difference of 0.050%), Immigrants from St. Vincent and the Grenadines (11.6%, a difference of 0.17%), Creek (11.7%, a difference of 0.23%), Immigrants from Cabo Verde (11.6%, a difference of 0.25%), and Immigrants from Senegal (11.7%, a difference of 0.37%).
| Demographics | Rating | Rank | Family Poverty |
| Immigrants | Barbados | 0.0 /100 | #289 | Tragic 11.5% |
| West Indians | 0.0 /100 | #290 | Tragic 11.5% |
| Haitians | 0.0 /100 | #291 | Tragic 11.5% |
| Immigrants | Somalia | 0.0 /100 | #292 | Tragic 11.5% |
| Immigrants | Cabo Verde | 0.0 /100 | #293 | Tragic 11.6% |
| Immigrants | St. Vincent and the Grenadines | 0.0 /100 | #294 | Tragic 11.6% |
| Immigrants | Haiti | 0.0 /100 | #295 | Tragic 11.6% |
| Choctaw | 0.0 /100 | #296 | Tragic 11.6% |
| Creek | 0.0 /100 | #297 | Tragic 11.7% |
| Immigrants | Senegal | 0.0 /100 | #298 | Tragic 11.7% |
| Dutch West Indians | 0.0 /100 | #299 | Tragic 11.7% |
| Immigrants | Bangladesh | 0.0 /100 | #300 | Tragic 11.7% |
| Bahamians | 0.0 /100 | #301 | Tragic 11.7% |
| Guatemalans | 0.0 /100 | #302 | Tragic 11.7% |
| Africans | 0.0 /100 | #303 | Tragic 11.8% |
Demographics Similar to French by Family Poverty
In terms of family poverty, the demographic groups most similar to French are Immigrants from Western Europe (8.2%, a difference of 0.070%), Immigrants from Russia (8.2%, a difference of 0.26%), South African (8.2%, a difference of 0.33%), Immigrants from Israel (8.2%, a difference of 0.39%), and Immigrants from Egypt (8.3%, a difference of 0.56%).
| Demographics | Rating | Rank | Family Poverty |
| Immigrants | France | 94.4 /100 | #112 | Exceptional 8.2% |
| Canadians | 94.2 /100 | #113 | Exceptional 8.2% |
| Immigrants | Zimbabwe | 94.0 /100 | #114 | Exceptional 8.2% |
| Immigrants | Israel | 93.5 /100 | #115 | Exceptional 8.2% |
| South Africans | 93.4 /100 | #116 | Exceptional 8.2% |
| Immigrants | Russia | 93.2 /100 | #117 | Exceptional 8.2% |
| Immigrants | Western Europe | 92.9 /100 | #118 | Exceptional 8.2% |
| French | 92.8 /100 | #119 | Exceptional 8.3% |
| Immigrants | Egypt | 91.6 /100 | #120 | Exceptional 8.3% |
| Native Hawaiians | 91.3 /100 | #121 | Exceptional 8.3% |
| Paraguayans | 91.2 /100 | #122 | Exceptional 8.3% |
| Palestinians | 91.1 /100 | #123 | Exceptional 8.3% |
| Soviet Union | 90.8 /100 | #124 | Exceptional 8.3% |
| Pakistanis | 90.8 /100 | #125 | Exceptional 8.3% |
| Icelanders | 90.3 /100 | #126 | Exceptional 8.3% |