Yuman vs Sierra Leonean Child Poverty Under the Age of 5

COMPARE

Yuman
Race
Ancestry
AfghanAfricanAlaska NativeAlaskan AthabascanAlbanianAleutAlsatianAmericanApacheArabArapahoArgentineanArmenianAssyrian/Chaldean/SyriacAustralianAustrianBahamianBangladeshiBarbadianBasqueBelgianBelizeanBermudanBhutaneseBlackfeetBolivianBrazilianBritishBritish West IndianBulgarianBurmeseCajunCambodianCanadianCape VerdeanCarpatho RusynCelticCentral AmericanCentral American IndianCherokeeCheyenneChickasawChileanChineseChippewaChoctawColombianColvilleComancheCosta RicanCreeCreekCroatianCrowCubanCypriotCzechCzechoslovakianDanishDelawareDominicanDutchDutch West IndianEastern EuropeanEcuadorianEgyptianEnglishEstonianEthiopianEuropeanFijianFilipinoFinnishFrenchFrench American IndianFrench CanadianGermanGerman RussianGhanaianGreekGuamanian/ChamorroGuatemalanGuyaneseHaitianHmongHonduranHopiHoumaHungarianIcelanderIndian (Asian)IndonesianInupiatIranianIraqiIrishIroquoisIsraeliItalianJamaicanJapaneseJordanianKenyanKiowaKoreanLaotianLatvianLebaneseLiberianLithuanianLumbeeLuxembourgerMacedonianMalaysianMalteseMarshalleseMenomineeMexicanMexican American IndianMongolianMoroccanNative HawaiianNavajoNepaleseNew ZealanderNicaraguanNigerianNorthern EuropeanNorwegianOkinawanOsageOttawaPaiutePakistaniPalestinianPanamanianParaguayanPennsylvania GermanPeruvianPimaPolishPortuguesePotawatomiPuebloPuerto RicanPuget Sound SalishRomanianRussianSalvadoranSamoanScandinavianScotch-IrishScottishSeminoleSenegaleseSerbianShoshoneSiouxSlavicSlovakSloveneSomaliSouth AfricanSouth AmericanSouth American IndianSoviet UnionSpaniardSpanishSpanish AmericanSpanish American IndianSri LankanSubsaharan AfricanSudaneseSwedishSwissSyrianTaiwaneseThaiTlingit-HaidaTohono O'OdhamTonganTrinidadian and TobagonianTsimshianTurkishU.S. Virgin IslanderUgandanUkrainianUruguayanUteVenezuelanVietnameseWelshWest IndianYakamaYaquiYugoslavianYumanYup'ikZimbabwean
Immigration
NonimmigrantsImmigrantsAfghanistanAfricaAlbaniaArgentinaArmeniaAsiaAustraliaAustriaBahamasBangladeshBarbadosBelarusBelgiumBelizeBoliviaBosnia and HerzegovinaBrazilBulgariaBurma/MyanmarCabo VerdeCambodiaCameroonCanadaCaribbeanCentral AmericaChileChinaColombiaCongoCosta RicaCroatiaCubaCzechoslovakiaDenmarkDominicaDominican RepublicEastern AfricaEastern AsiaEastern EuropeEcuadorEgyptEl SalvadorEnglandEritreaEthiopiaEuropeFijiFranceGermanyGhanaGreeceGrenadaGuatemalaGuyanaHaitiHondurasHong KongHungaryIndiaIndonesiaIranIraqIrelandIsraelItalyJamaicaJapanJordanKazakhstanKenyaKoreaKuwaitLaosLatin AmericaLatviaLebanonLiberiaLithuaniaMalaysiaMexicoMicronesiaMiddle AfricaMoldovaMoroccoNepalNetherlandsNicaraguaNigeriaNorth AmericaNorth MacedoniaNorthern AfricaNorthern EuropeNorwayOceaniaPakistanPanamaPeruPhilippinesPolandPortugalRomaniaRussiaSaudi ArabiaScotlandSenegalSerbiaSierra LeoneSingaporeSomaliaSouth AfricaSouth AmericaSouth Central AsiaSouth Eastern AsiaSouthern EuropeSpainSri LankaSt. Vincent and the GrenadinesSudanSwedenSwitzerlandSyriaTaiwanThailandTrinidad and TobagoTurkeyUgandaUkraineUruguayUzbekistanVenezuelaVietnamWest IndiesWestern AfricaWestern AsiaWestern EuropeYemenZaireZimbabweAzores
Sierra Leonean
Race
Ancestry
AfghanAfricanAlaska NativeAlaskan AthabascanAlbanianAleutAlsatianAmericanApacheArabArapahoArgentineanArmenianAssyrian/Chaldean/SyriacAustralianAustrianBahamianBangladeshiBarbadianBasqueBelgianBelizeanBermudanBhutaneseBlackfeetBolivianBrazilianBritishBritish West IndianBulgarianBurmeseCajunCambodianCanadianCape VerdeanCarpatho RusynCelticCentral AmericanCentral American IndianCherokeeCheyenneChickasawChileanChineseChippewaChoctawColombianColvilleComancheCosta RicanCreeCreekCroatianCrowCubanCypriotCzechCzechoslovakianDanishDelawareDominicanDutchDutch West IndianEastern EuropeanEcuadorianEgyptianEnglishEstonianEthiopianEuropeanFijianFilipinoFinnishFrenchFrench American IndianFrench CanadianGermanGerman RussianGhanaianGreekGuamanian/ChamorroGuatemalanGuyaneseHaitianHmongHonduranHopiHoumaHungarianIcelanderIndian (Asian)IndonesianInupiatIranianIraqiIrishIroquoisIsraeliItalianJamaicanJapaneseJordanianKenyanKiowaKoreanLaotianLatvianLebaneseLiberianLithuanianLumbeeLuxembourgerMacedonianMalaysianMalteseMarshalleseMenomineeMexicanMexican American IndianMongolianMoroccanNative HawaiianNavajoNepaleseNew ZealanderNicaraguanNigerianNorthern EuropeanNorwegianOkinawanOsageOttawaPaiutePakistaniPalestinianPanamanianParaguayanPennsylvania GermanPeruvianPimaPolishPortuguesePotawatomiPuebloPuerto RicanPuget Sound SalishRomanianRussianSalvadoranSamoanScandinavianScotch-IrishScottishSeminoleSenegaleseSerbianShoshoneSierra LeoneanSiouxSlavicSlovakSloveneSomaliSouth AfricanSouth AmericanSouth American IndianSoviet UnionSpaniardSpanishSpanish AmericanSpanish American IndianSri LankanSubsaharan AfricanSudaneseSwedishSwissSyrianTaiwaneseThaiTlingit-HaidaTohono O'OdhamTonganTrinidadian and TobagonianTsimshianTurkishU.S. Virgin IslanderUgandanUkrainianUruguayanUteVenezuelanVietnameseWelshWest IndianYakamaYaquiYugoslavianYup'ikZimbabwean
Immigration
NonimmigrantsImmigrantsAfghanistanAfricaAlbaniaArgentinaArmeniaAsiaAustraliaAustriaBahamasBangladeshBarbadosBelarusBelgiumBelizeBoliviaBosnia and HerzegovinaBrazilBulgariaBurma/MyanmarCabo VerdeCambodiaCameroonCanadaCaribbeanCentral AmericaChileChinaColombiaCongoCosta RicaCroatiaCubaCzechoslovakiaDenmarkDominicaDominican RepublicEastern AfricaEastern AsiaEastern EuropeEcuadorEgyptEl SalvadorEnglandEritreaEthiopiaEuropeFijiFranceGermanyGhanaGreeceGrenadaGuatemalaGuyanaHaitiHondurasHong KongHungaryIndiaIndonesiaIranIraqIrelandIsraelItalyJamaicaJapanJordanKazakhstanKenyaKoreaKuwaitLaosLatin AmericaLatviaLebanonLiberiaLithuaniaMalaysiaMexicoMicronesiaMiddle AfricaMoldovaMoroccoNepalNetherlandsNicaraguaNigeriaNorth AmericaNorth MacedoniaNorthern AfricaNorthern EuropeNorwayOceaniaPakistanPanamaPeruPhilippinesPolandPortugalRomaniaRussiaSaudi ArabiaScotlandSenegalSerbiaSierra LeoneSingaporeSomaliaSouth AfricaSouth AmericaSouth Central AsiaSouth Eastern AsiaSouthern EuropeSpainSri LankaSt. Vincent and the GrenadinesSudanSwedenSwitzerlandSyriaTaiwanThailandTrinidad and TobagoTurkeyUgandaUkraineUruguayUzbekistanVenezuelaVietnamWest IndiesWestern AfricaWestern AsiaWestern EuropeYemenZaireZimbabweAzores
Child Poverty Under the Age of 5
Income
Poverty
Unemployment
Labor Participation
Family Structure
Vehicle Availability
Education Level
Disability

Child Poverty Under the Age of 5 Comparison

Yuman

Sierra Leoneans

Tragic
Fair
29.5%
CHILD POVERTY UNDER THE AGE OF 5
0.0/ 100
METRIC RATING
343rd/ 347
METRIC RANK
17.7%
CHILD POVERTY UNDER THE AGE OF 5
24.1/ 100
METRIC RATING
195th/ 347
METRIC RANK

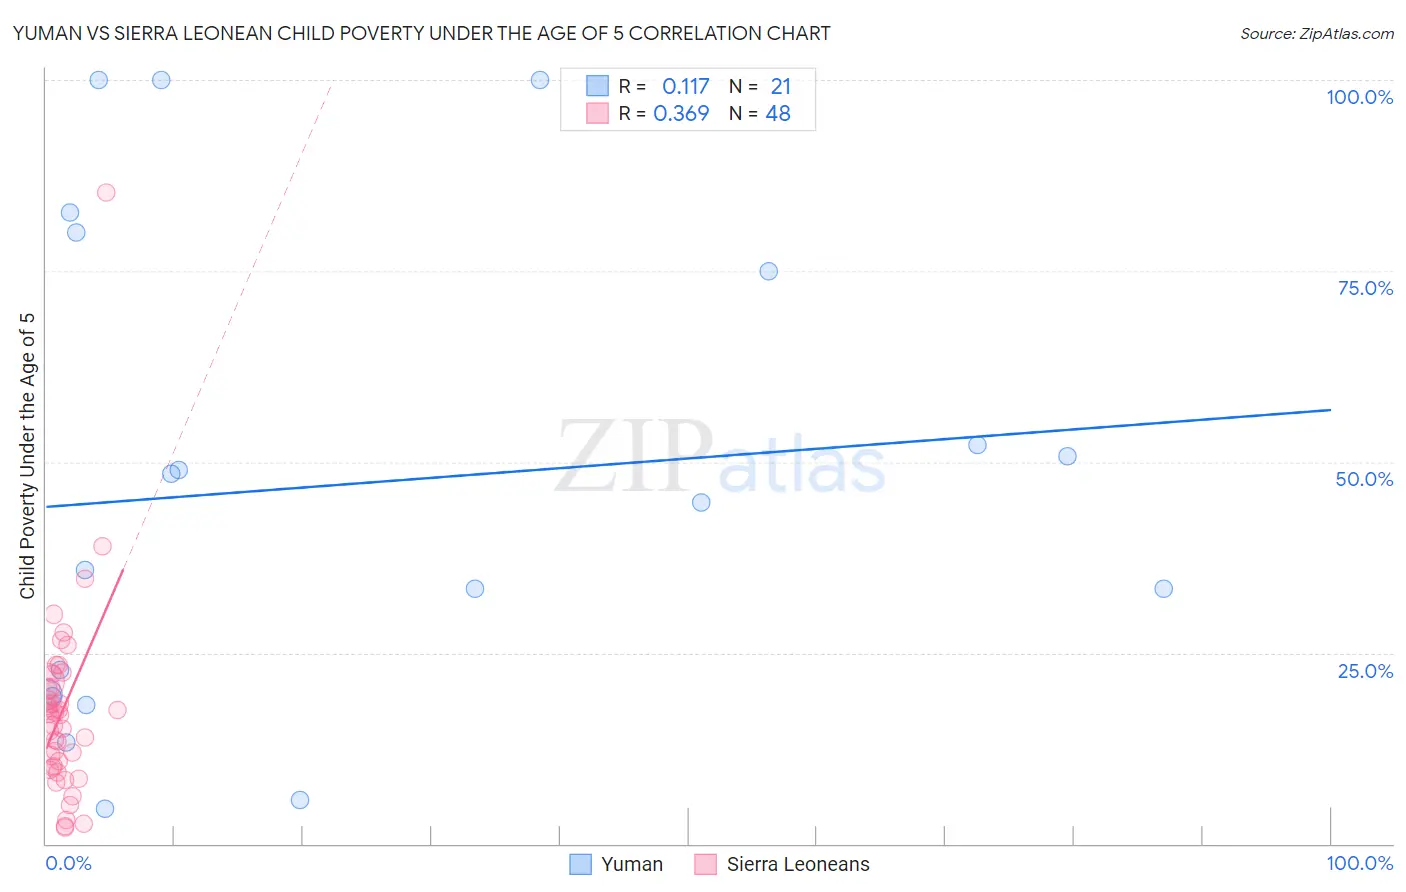
Yuman vs Sierra Leonean Child Poverty Under the Age of 5 Correlation Chart

The statistical analysis conducted on geographies consisting of 40,515,033 people shows a poor positive correlation between the proportion of Yuman and poverty level among children under the age of 5 in the United States with a correlation coefficient (R) of 0.117 and weighted average of 29.5%. Similarly, the statistical analysis conducted on geographies consisting of 82,787,385 people shows a mild positive correlation between the proportion of Sierra Leoneans and poverty level among children under the age of 5 in the United States with a correlation coefficient (R) of 0.369 and weighted average of 17.7%, a difference of 66.5%.
Yuman vs Sierra Leonean Child Poverty Under the Age of 5

Child Poverty Under the Age of 5 Correlation Summary

MeasurementYumanSierra Leonean
Minimum4.6%2.1%
Maximum100.0%85.3%
Range95.4%83.2%
Mean47.1%17.4%
Median44.7%16.9%
Interquartile 25% (IQ1)19.4%10.1%
Interquartile 75% (IQ3)77.5%20.8%
Interquartile Range (IQR)58.1%10.8%
Standard Deviation (Sample)31.4%12.9%
Standard Deviation (Population)30.6%12.7%

Similar Demographics by Child Poverty Under the Age of 5

Demographics Similar to Yuman by Child Poverty Under the Age of 5

In terms of child poverty under the age of 5, the demographic groups most similar to Yuman are Tohono O'odham (29.5%, a difference of 0.16%), Immigrants from Yemen (29.3%, a difference of 0.84%), Cheyenne (28.3%, a difference of 4.3%), Crow (31.0%, a difference of 4.9%), and Yup'ik (27.7%, a difference of 6.6%).
DemographicsRating | RankChild Poverty Under the Age of 5
Natives/Alaskans
0.0
/100
|
#333
Tragic
25.6%
Blacks/African Americans
0.0
/100
|
#334
Tragic
25.7%
Colville
0.0
/100
|
#335
Tragic
25.7%
Sioux
0.0
/100
|
#336
Tragic
26.9%
Pima
0.0
/100
|
#337
Tragic
27.4%
Hopi
0.0
/100
|
#338
Tragic
27.7%
Yup'ik
0.0
/100
|
#339
Tragic
27.7%
Cheyenne
0.0
/100
|
#340
Tragic
28.3%
Immigrants | Yemen
0.0
/100
|
#341
Tragic
29.3%
Tohono O'odham
0.0
/100
|
#342
Tragic
29.5%
Yuman
0.0
/100
|
#343
Tragic
29.5%
Crow
0.0
/100
|
#344
Tragic
31.0%
Navajo
0.0
/100
|
#345
Tragic
31.6%
Lumbee
0.0
/100
|
#346
Tragic
33.3%
Puerto Ricans
0.0
/100
|
#347
Tragic
34.5%

Demographics Similar to Sierra Leoneans by Child Poverty Under the Age of 5

In terms of child poverty under the age of 5, the demographic groups most similar to Sierra Leoneans are French Canadian (17.7%, a difference of 0.070%), Immigrants from Uganda (17.7%, a difference of 0.12%), Immigrants from Portugal (17.8%, a difference of 0.27%), Immigrants from Uruguay (17.7%, a difference of 0.49%), and Immigrants from Afghanistan (17.7%, a difference of 0.50%).
DemographicsRating | RankChild Poverty Under the Age of 5
Carpatho Rusyns
33.6
/100
|
#188
Fair
17.5%
French
33.6
/100
|
#189
Fair
17.5%
Slovaks
29.2
/100
|
#190
Fair
17.6%
Immigrants | Afghanistan
27.9
/100
|
#191
Fair
17.7%
Immigrants | Uruguay
27.8
/100
|
#192
Fair
17.7%
Immigrants | Uganda
25.0
/100
|
#193
Fair
17.7%
French Canadians
24.6
/100
|
#194
Fair
17.7%
Sierra Leoneans
24.1
/100
|
#195
Fair
17.7%
Immigrants | Portugal
22.2
/100
|
#196
Fair
17.8%
Immigrants | Kenya
20.0
/100
|
#197
Fair
17.9%
Celtics
18.3
/100
|
#198
Poor
17.9%
Hungarians
18.3
/100
|
#199
Poor
17.9%
Iraqis
14.0
/100
|
#200
Poor
18.0%
Ugandans
13.9
/100
|
#201
Poor
18.0%
Japanese
13.8
/100
|
#202
Poor
18.1%