Yuman vs Immigrants from Trinidad and Tobago Child Poverty Under the Age of 5
COMPARE
Yuman
Immigrants from Trinidad and Tobago
Child Poverty Under the Age of 5
Child Poverty Under the Age of 5 Comparison
Yuman
Immigrants from Trinidad and Tobago
29.5%
CHILD POVERTY UNDER THE AGE OF 5
0.0/ 100
METRIC RATING
343rd/ 347
METRIC RANK
19.4%
CHILD POVERTY UNDER THE AGE OF 5
0.8/ 100
METRIC RATING
236th/ 347
METRIC RANK
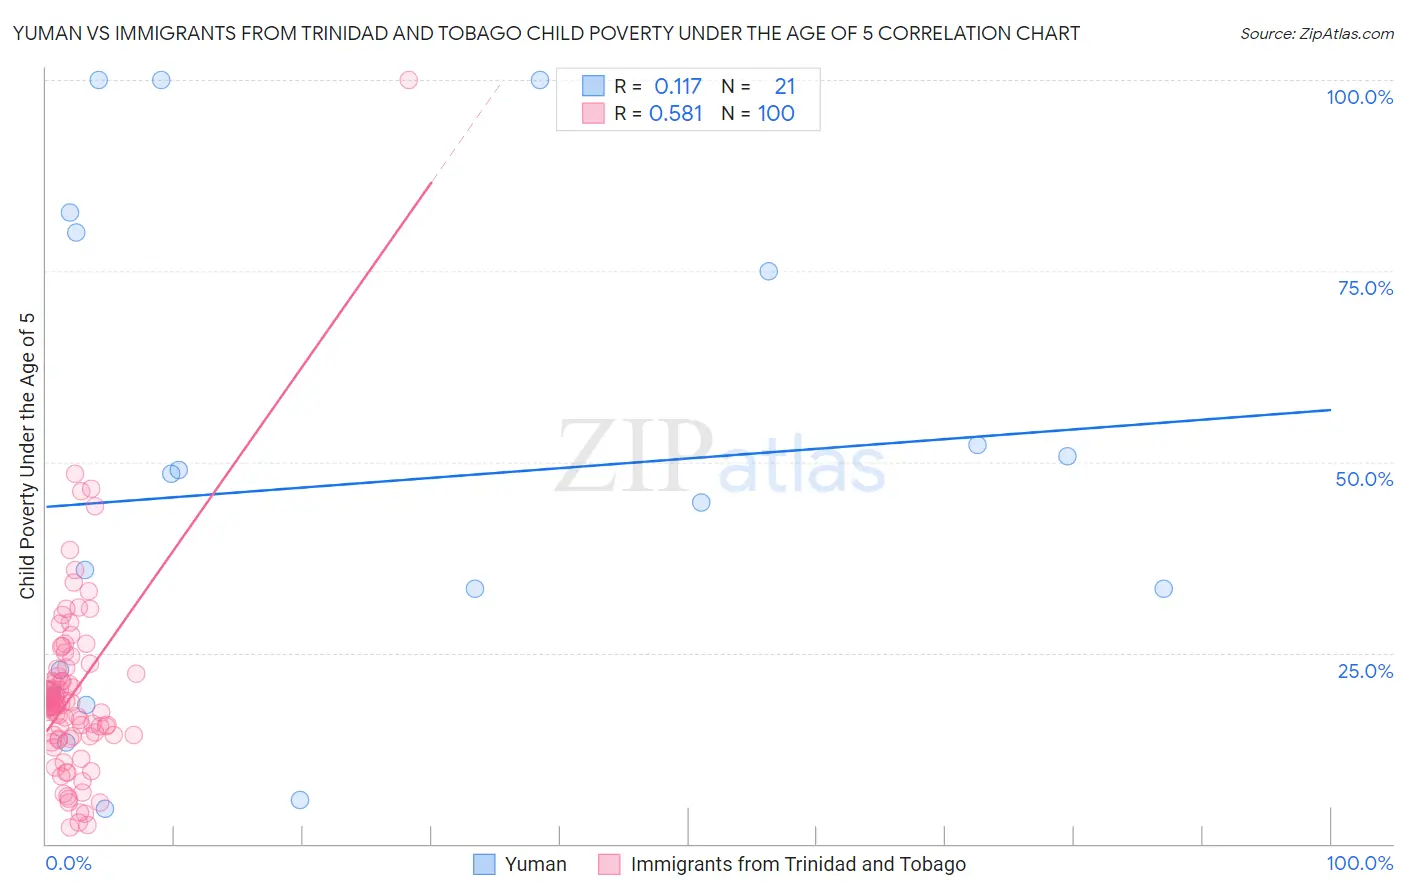
Yuman vs Immigrants from Trinidad and Tobago Child Poverty Under the Age of 5 Correlation Chart
The statistical analysis conducted on geographies consisting of 40,515,033 people shows a poor positive correlation between the proportion of Yuman and poverty level among children under the age of 5 in the United States with a correlation coefficient (R) of 0.117 and weighted average of 29.5%. Similarly, the statistical analysis conducted on geographies consisting of 218,090,061 people shows a substantial positive correlation between the proportion of Immigrants from Trinidad and Tobago and poverty level among children under the age of 5 in the United States with a correlation coefficient (R) of 0.581 and weighted average of 19.4%, a difference of 52.3%.
Child Poverty Under the Age of 5 Correlation Summary
| Measurement | Yuman | Immigrants from Trinidad and Tobago |
| Minimum | 4.6% | 2.2% |
| Maximum | 100.0% | 100.0% |
| Range | 95.4% | 97.8% |
| Mean | 47.1% | 19.7% |
| Median | 44.7% | 18.1% |
| Interquartile 25% (IQ1) | 19.4% | 14.1% |
| Interquartile 75% (IQ3) | 77.5% | 22.6% |
| Interquartile Range (IQR) | 58.1% | 8.5% |
| Standard Deviation (Sample) | 31.4% | 12.4% |
| Standard Deviation (Population) | 30.6% | 12.3% |
Similar Demographics by Child Poverty Under the Age of 5
Demographics Similar to Yuman by Child Poverty Under the Age of 5
In terms of child poverty under the age of 5, the demographic groups most similar to Yuman are Tohono O'odham (29.5%, a difference of 0.16%), Immigrants from Yemen (29.3%, a difference of 0.84%), Cheyenne (28.3%, a difference of 4.3%), Crow (31.0%, a difference of 4.9%), and Yup'ik (27.7%, a difference of 6.6%).
| Demographics | Rating | Rank | Child Poverty Under the Age of 5 |
| Natives/Alaskans | 0.0 /100 | #333 | Tragic 25.6% |
| Blacks/African Americans | 0.0 /100 | #334 | Tragic 25.7% |
| Colville | 0.0 /100 | #335 | Tragic 25.7% |
| Sioux | 0.0 /100 | #336 | Tragic 26.9% |
| Pima | 0.0 /100 | #337 | Tragic 27.4% |
| Hopi | 0.0 /100 | #338 | Tragic 27.7% |
| Yup'ik | 0.0 /100 | #339 | Tragic 27.7% |
| Cheyenne | 0.0 /100 | #340 | Tragic 28.3% |
| Immigrants | Yemen | 0.0 /100 | #341 | Tragic 29.3% |
| Tohono O'odham | 0.0 /100 | #342 | Tragic 29.5% |
| Yuman | 0.0 /100 | #343 | Tragic 29.5% |
| Crow | 0.0 /100 | #344 | Tragic 31.0% |
| Navajo | 0.0 /100 | #345 | Tragic 31.6% |
| Lumbee | 0.0 /100 | #346 | Tragic 33.3% |
| Puerto Ricans | 0.0 /100 | #347 | Tragic 34.5% |
Demographics Similar to Immigrants from Trinidad and Tobago by Child Poverty Under the Age of 5
In terms of child poverty under the age of 5, the demographic groups most similar to Immigrants from Trinidad and Tobago are Immigrants from Laos (19.4%, a difference of 0.0%), Immigrants from Micronesia (19.4%, a difference of 0.21%), Sudanese (19.3%, a difference of 0.34%), Trinidadian and Tobagonian (19.3%, a difference of 0.39%), and Immigrants from Cabo Verde (19.5%, a difference of 0.55%).
| Demographics | Rating | Rank | Child Poverty Under the Age of 5 |
| Ghanaians | 1.2 /100 | #229 | Tragic 19.2% |
| Ecuadorians | 1.2 /100 | #230 | Tragic 19.2% |
| Bermudans | 1.2 /100 | #231 | Tragic 19.2% |
| Trinidadians and Tobagonians | 0.9 /100 | #232 | Tragic 19.3% |
| Sudanese | 0.9 /100 | #233 | Tragic 19.3% |
| Immigrants | Micronesia | 0.9 /100 | #234 | Tragic 19.4% |
| Immigrants | Laos | 0.8 /100 | #235 | Tragic 19.4% |
| Immigrants | Trinidad and Tobago | 0.8 /100 | #236 | Tragic 19.4% |
| Immigrants | Cabo Verde | 0.6 /100 | #237 | Tragic 19.5% |
| Salvadorans | 0.6 /100 | #238 | Tragic 19.5% |
| Vietnamese | 0.6 /100 | #239 | Tragic 19.5% |
| Immigrants | Ecuador | 0.5 /100 | #240 | Tragic 19.6% |
| Alaska Natives | 0.5 /100 | #241 | Tragic 19.6% |
| Immigrants | Guyana | 0.5 /100 | #242 | Tragic 19.6% |
| Osage | 0.5 /100 | #243 | Tragic 19.6% |