Yuman vs Immigrants from North America Single Male Poverty
COMPARE
Yuman
Immigrants from North America
Single Male Poverty
Single Male Poverty Comparison
Yuman
Immigrants from North America
21.3%
SINGLE MALE POVERTY
0.0/ 100
METRIC RATING
335th/ 347
METRIC RANK
12.9%
SINGLE MALE POVERTY
37.7/ 100
METRIC RATING
180th/ 347
METRIC RANK
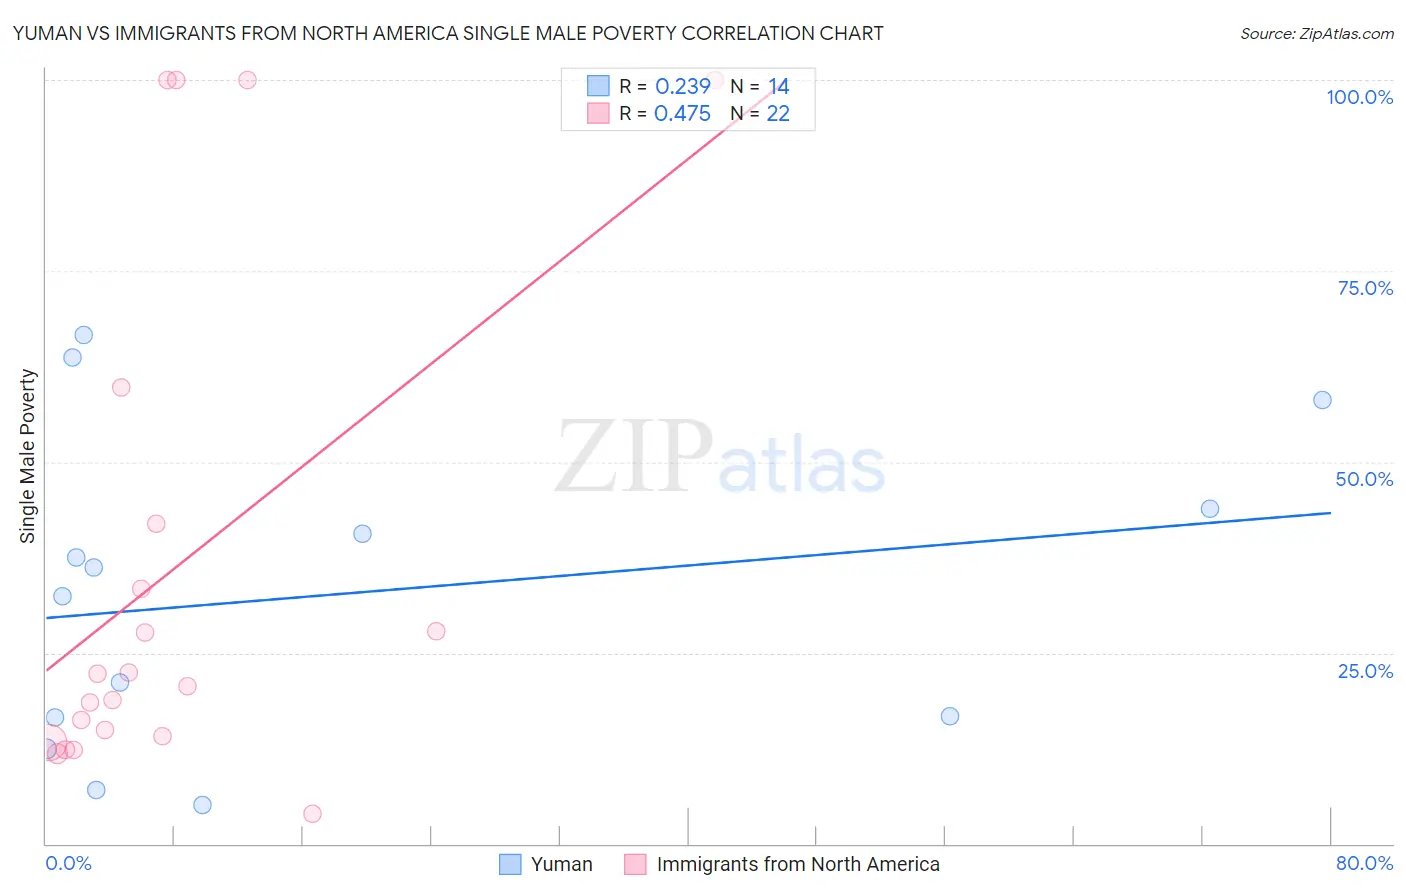
Yuman vs Immigrants from North America Single Male Poverty Correlation Chart
The statistical analysis conducted on geographies consisting of 40,221,035 people shows a weak positive correlation between the proportion of Yuman and poverty level among single males in the United States with a correlation coefficient (R) of 0.239 and weighted average of 21.3%. Similarly, the statistical analysis conducted on geographies consisting of 398,248,842 people shows a moderate positive correlation between the proportion of Immigrants from North America and poverty level among single males in the United States with a correlation coefficient (R) of 0.475 and weighted average of 12.9%, a difference of 65.4%.
Single Male Poverty Correlation Summary
| Measurement | Yuman | Immigrants from North America |
| Minimum | 5.0% | 4.0% |
| Maximum | 66.7% | 100.0% |
| Range | 61.7% | 96.0% |
| Mean | 32.7% | 36.0% |
| Median | 34.3% | 21.5% |
| Interquartile 25% (IQ1) | 16.6% | 14.1% |
| Interquartile 75% (IQ3) | 43.9% | 41.9% |
| Interquartile Range (IQR) | 27.3% | 27.8% |
| Standard Deviation (Sample) | 20.5% | 33.0% |
| Standard Deviation (Population) | 19.8% | 32.3% |
Similar Demographics by Single Male Poverty
Demographics Similar to Yuman by Single Male Poverty
In terms of single male poverty, the demographic groups most similar to Yuman are Tohono O'odham (21.6%, a difference of 1.2%), Apache (21.6%, a difference of 1.3%), Pueblo (21.6%, a difference of 1.5%), Arapaho (21.9%, a difference of 3.0%), and Sioux (22.2%, a difference of 4.3%).
| Demographics | Rating | Rank | Single Male Poverty |
| Kiowa | 0.0 /100 | #328 | Tragic 18.3% |
| Colville | 0.0 /100 | #329 | Tragic 18.4% |
| Cajuns | 0.0 /100 | #330 | Tragic 19.1% |
| Paiute | 0.0 /100 | #331 | Tragic 19.3% |
| Natives/Alaskans | 0.0 /100 | #332 | Tragic 19.6% |
| Inupiat | 0.0 /100 | #333 | Tragic 20.0% |
| Pima | 0.0 /100 | #334 | Tragic 20.2% |
| Yuman | 0.0 /100 | #335 | Tragic 21.3% |
| Tohono O'odham | 0.0 /100 | #336 | Tragic 21.6% |
| Apache | 0.0 /100 | #337 | Tragic 21.6% |
| Pueblo | 0.0 /100 | #338 | Tragic 21.6% |
| Arapaho | 0.0 /100 | #339 | Tragic 21.9% |
| Sioux | 0.0 /100 | #340 | Tragic 22.2% |
| Crow | 0.0 /100 | #341 | Tragic 23.3% |
| Houma | 0.0 /100 | #342 | Tragic 23.5% |
Demographics Similar to Immigrants from North America by Single Male Poverty
In terms of single male poverty, the demographic groups most similar to Immigrants from North America are Panamanian (12.9%, a difference of 0.010%), Moroccan (12.9%, a difference of 0.050%), Israeli (12.9%, a difference of 0.18%), Immigrants from West Indies (12.9%, a difference of 0.27%), and Immigrants from Switzerland (12.8%, a difference of 0.29%).
| Demographics | Rating | Rank | Single Male Poverty |
| Immigrants | St. Vincent and the Grenadines | 50.9 /100 | #173 | Average 12.8% |
| Costa Ricans | 50.0 /100 | #174 | Average 12.8% |
| Croatians | 48.9 /100 | #175 | Average 12.8% |
| Syrians | 48.4 /100 | #176 | Average 12.8% |
| Immigrants | Canada | 44.8 /100 | #177 | Average 12.8% |
| Immigrants | Switzerland | 43.1 /100 | #178 | Average 12.8% |
| Israelis | 41.0 /100 | #179 | Average 12.9% |
| Immigrants | North America | 37.7 /100 | #180 | Fair 12.9% |
| Panamanians | 37.6 /100 | #181 | Fair 12.9% |
| Moroccans | 36.8 /100 | #182 | Fair 12.9% |
| Immigrants | West Indies | 33.0 /100 | #183 | Fair 12.9% |
| Immigrants | Trinidad and Tobago | 32.5 /100 | #184 | Fair 12.9% |
| Norwegians | 32.0 /100 | #185 | Fair 12.9% |
| Nigerians | 31.9 /100 | #186 | Fair 12.9% |
| Immigrants | Kuwait | 31.9 /100 | #187 | Fair 12.9% |