Yuman vs Immigrants from North America Unemployment Among Women with Children Ages 6 to 17 years
COMPARE
Yuman
Immigrants from North America
Unemployment Among Women with Children Ages 6 to 17 years
Unemployment Among Women with Children Ages 6 to 17 years Comparison
Yuman
Immigrants from North America
14.8%
UNEMPLOYMENT AMONG WOMEN WITH CHILDREN AGES 6 TO 17 YEARS
0.0/ 100
METRIC RATING
342nd/ 347
METRIC RANK
9.2%
UNEMPLOYMENT AMONG WOMEN WITH CHILDREN AGES 6 TO 17 YEARS
12.7/ 100
METRIC RATING
206th/ 347
METRIC RANK
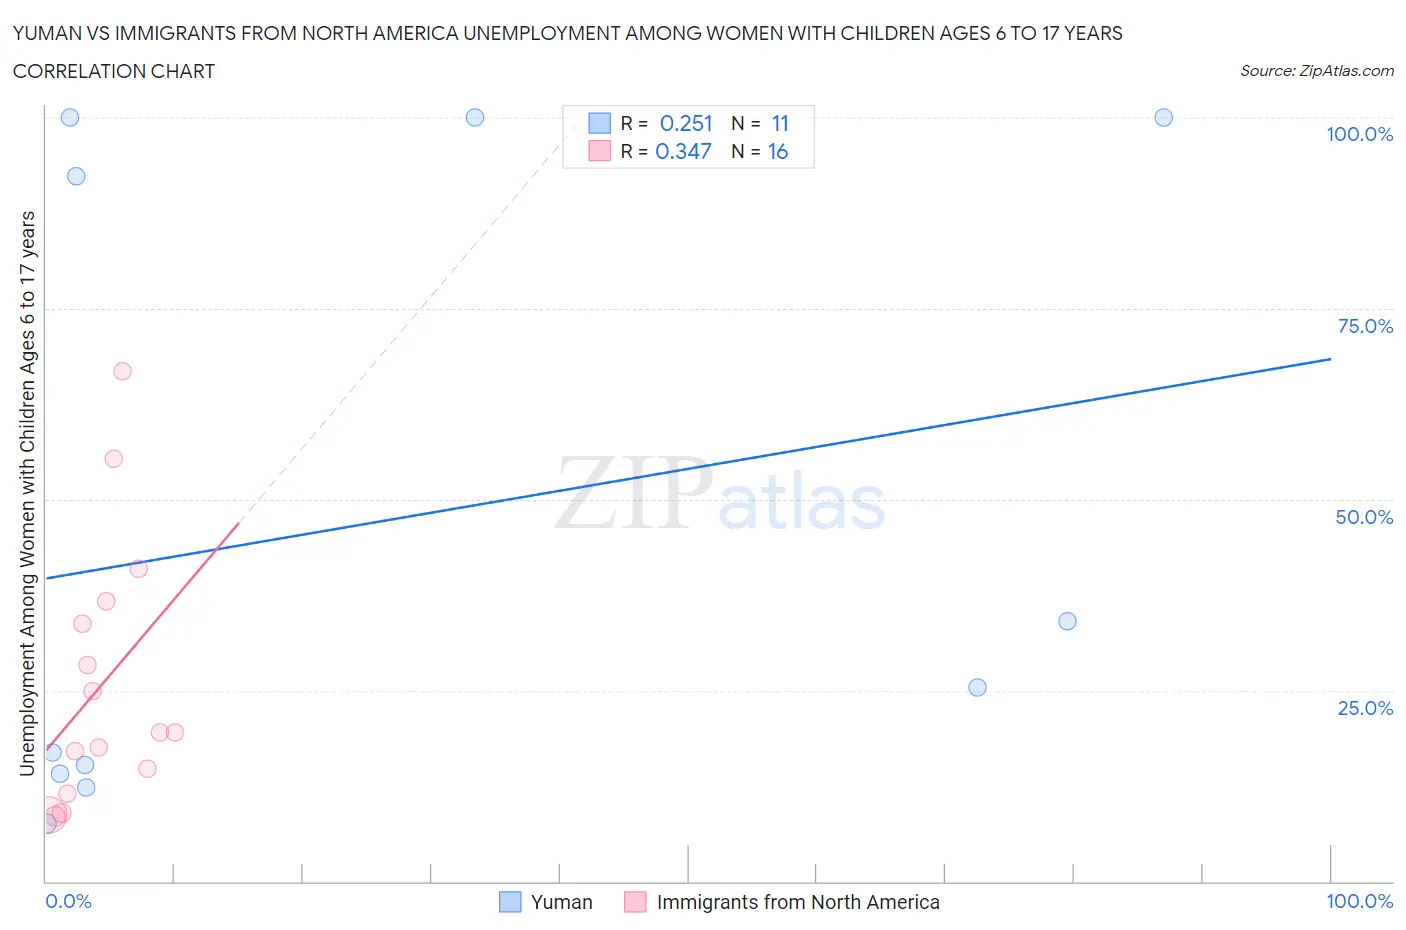
Yuman vs Immigrants from North America Unemployment Among Women with Children Ages 6 to 17 years Correlation Chart
The statistical analysis conducted on geographies consisting of 38,308,560 people shows a weak positive correlation between the proportion of Yuman and unemployment rate among women with children between the ages 6 and 17 in the United States with a correlation coefficient (R) of 0.251 and weighted average of 14.8%. Similarly, the statistical analysis conducted on geographies consisting of 313,856,079 people shows a mild positive correlation between the proportion of Immigrants from North America and unemployment rate among women with children between the ages 6 and 17 in the United States with a correlation coefficient (R) of 0.347 and weighted average of 9.2%, a difference of 61.7%.
Unemployment Among Women with Children Ages 6 to 17 years Correlation Summary
| Measurement | Yuman | Immigrants from North America |
| Minimum | 7.5% | 8.5% |
| Maximum | 100.0% | 66.7% |
| Range | 92.5% | 58.2% |
| Mean | 47.1% | 25.8% |
| Median | 25.4% | 19.4% |
| Interquartile 25% (IQ1) | 14.1% | 13.1% |
| Interquartile 75% (IQ3) | 100.0% | 35.2% |
| Interquartile Range (IQR) | 85.9% | 22.2% |
| Standard Deviation (Sample) | 41.1% | 17.1% |
| Standard Deviation (Population) | 39.2% | 16.6% |
Similar Demographics by Unemployment Among Women with Children Ages 6 to 17 years
Demographics Similar to Yuman by Unemployment Among Women with Children Ages 6 to 17 years
In terms of unemployment among women with children ages 6 to 17 years, the demographic groups most similar to Yuman are Inupiat (14.9%, a difference of 0.29%), Navajo (14.2%, a difference of 4.6%), Puerto Rican (13.9%, a difference of 6.8%), Cheyenne (16.4%, a difference of 10.6%), and Sioux (13.2%, a difference of 11.9%).
| Demographics | Rating | Rank | Unemployment Among Women with Children Ages 6 to 17 years |
| Natives/Alaskans | 0.0 /100 | #333 | Tragic 11.5% |
| Ugandans | 0.0 /100 | #334 | Tragic 12.0% |
| Colville | 0.0 /100 | #335 | Tragic 12.3% |
| Houma | 0.0 /100 | #336 | Tragic 12.5% |
| Immigrants | Yemen | 0.0 /100 | #337 | Tragic 12.7% |
| Hopi | 0.0 /100 | #338 | Tragic 12.9% |
| Sioux | 0.0 /100 | #339 | Tragic 13.2% |
| Puerto Ricans | 0.0 /100 | #340 | Tragic 13.9% |
| Navajo | 0.0 /100 | #341 | Tragic 14.2% |
| Yuman | 0.0 /100 | #342 | Tragic 14.8% |
| Inupiat | 0.0 /100 | #343 | Tragic 14.9% |
| Cheyenne | 0.0 /100 | #344 | Tragic 16.4% |
| Arapaho | 0.0 /100 | #345 | Tragic 16.8% |
| Yup'ik | 0.0 /100 | #346 | Tragic 18.6% |
| Pima | 0.0 /100 | #347 | Tragic 18.9% |
Demographics Similar to Immigrants from North America by Unemployment Among Women with Children Ages 6 to 17 years
In terms of unemployment among women with children ages 6 to 17 years, the demographic groups most similar to Immigrants from North America are Immigrants from Western Europe (9.1%, a difference of 0.13%), Cuban (9.2%, a difference of 0.20%), Immigrants from Peru (9.2%, a difference of 0.20%), Salvadoran (9.2%, a difference of 0.21%), and Immigrants from Canada (9.1%, a difference of 0.23%).
| Demographics | Rating | Rank | Unemployment Among Women with Children Ages 6 to 17 years |
| Czechoslovakians | 20.8 /100 | #199 | Fair 9.1% |
| Trinidadians and Tobagonians | 18.2 /100 | #200 | Poor 9.1% |
| Immigrants | Trinidad and Tobago | 16.7 /100 | #201 | Poor 9.1% |
| Immigrants | Middle Africa | 15.6 /100 | #202 | Poor 9.1% |
| Maltese | 15.3 /100 | #203 | Poor 9.1% |
| Immigrants | Canada | 15.3 /100 | #204 | Poor 9.1% |
| Immigrants | Western Europe | 14.1 /100 | #205 | Poor 9.1% |
| Immigrants | North America | 12.7 /100 | #206 | Poor 9.2% |
| Cubans | 10.9 /100 | #207 | Poor 9.2% |
| Immigrants | Peru | 10.8 /100 | #208 | Poor 9.2% |
| Salvadorans | 10.7 /100 | #209 | Poor 9.2% |
| Finns | 10.0 /100 | #210 | Tragic 9.2% |
| Immigrants | Cuba | 9.6 /100 | #211 | Tragic 9.2% |
| Peruvians | 9.0 /100 | #212 | Tragic 9.2% |
| Spaniards | 8.2 /100 | #213 | Tragic 9.2% |