Immigrants from Eastern Europe vs Immigrants from North America Single Male Poverty
COMPARE
Immigrants from Eastern Europe
Immigrants from North America
Single Male Poverty
Single Male Poverty Comparison
Immigrants from Eastern Europe
Immigrants from North America
11.8%
SINGLE MALE POVERTY
99.6/ 100
METRIC RATING
64th/ 347
METRIC RANK
12.9%
SINGLE MALE POVERTY
37.7/ 100
METRIC RATING
180th/ 347
METRIC RANK
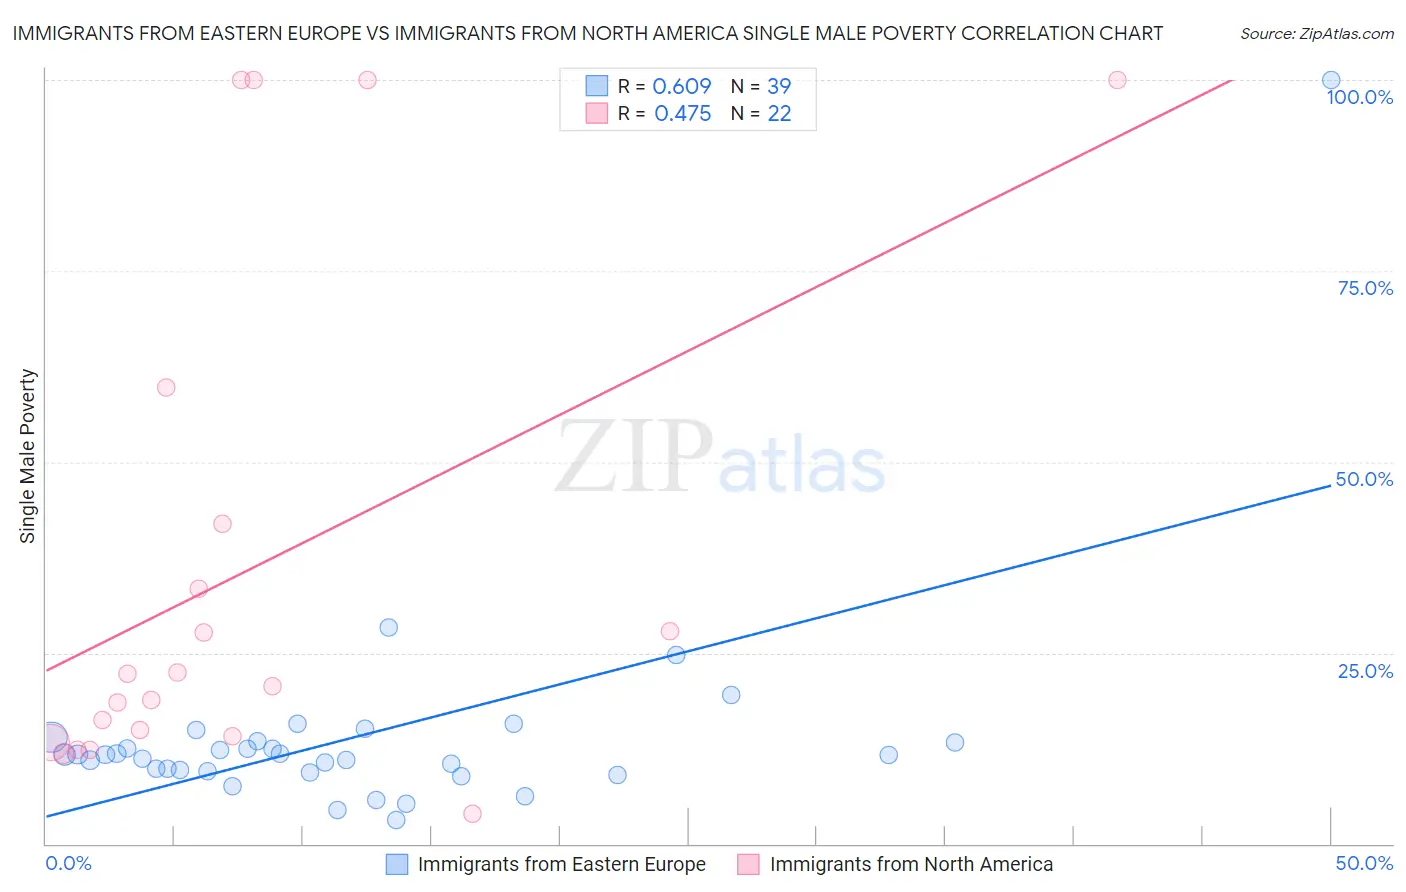
Immigrants from Eastern Europe vs Immigrants from North America Single Male Poverty Correlation Chart
The statistical analysis conducted on geographies consisting of 407,915,677 people shows a significant positive correlation between the proportion of Immigrants from Eastern Europe and poverty level among single males in the United States with a correlation coefficient (R) of 0.609 and weighted average of 11.8%. Similarly, the statistical analysis conducted on geographies consisting of 398,248,842 people shows a moderate positive correlation between the proportion of Immigrants from North America and poverty level among single males in the United States with a correlation coefficient (R) of 0.475 and weighted average of 12.9%, a difference of 8.7%.
Single Male Poverty Correlation Summary
| Measurement | Immigrants from Eastern Europe | Immigrants from North America |
| Minimum | 3.1% | 4.0% |
| Maximum | 100.0% | 100.0% |
| Range | 96.9% | 96.0% |
| Mean | 14.0% | 36.0% |
| Median | 11.6% | 21.5% |
| Interquartile 25% (IQ1) | 9.6% | 14.1% |
| Interquartile 75% (IQ3) | 13.3% | 41.9% |
| Interquartile Range (IQR) | 3.8% | 27.8% |
| Standard Deviation (Sample) | 14.9% | 33.0% |
| Standard Deviation (Population) | 14.7% | 32.3% |
Similar Demographics by Single Male Poverty
Demographics Similar to Immigrants from Eastern Europe by Single Male Poverty
In terms of single male poverty, the demographic groups most similar to Immigrants from Eastern Europe are Laotian (11.9%, a difference of 0.10%), Immigrants from Uruguay (11.9%, a difference of 0.10%), Immigrants from Ukraine (11.9%, a difference of 0.12%), Immigrants from Croatia (11.9%, a difference of 0.13%), and Immigrants from Belarus (11.8%, a difference of 0.14%).
| Demographics | Rating | Rank | Single Male Poverty |
| Immigrants | Romania | 99.8 /100 | #57 | Exceptional 11.7% |
| Immigrants | Brazil | 99.8 /100 | #58 | Exceptional 11.7% |
| Brazilians | 99.8 /100 | #59 | Exceptional 11.8% |
| Peruvians | 99.8 /100 | #60 | Exceptional 11.8% |
| Cambodians | 99.8 /100 | #61 | Exceptional 11.8% |
| Immigrants | Sri Lanka | 99.7 /100 | #62 | Exceptional 11.8% |
| Immigrants | Belarus | 99.7 /100 | #63 | Exceptional 11.8% |
| Immigrants | Eastern Europe | 99.6 /100 | #64 | Exceptional 11.8% |
| Laotians | 99.6 /100 | #65 | Exceptional 11.9% |
| Immigrants | Uruguay | 99.6 /100 | #66 | Exceptional 11.9% |
| Immigrants | Ukraine | 99.6 /100 | #67 | Exceptional 11.9% |
| Immigrants | Croatia | 99.6 /100 | #68 | Exceptional 11.9% |
| Immigrants | Russia | 99.6 /100 | #69 | Exceptional 11.9% |
| Immigrants | Nepal | 99.6 /100 | #70 | Exceptional 11.9% |
| Immigrants | Greece | 99.6 /100 | #71 | Exceptional 11.9% |
Demographics Similar to Immigrants from North America by Single Male Poverty
In terms of single male poverty, the demographic groups most similar to Immigrants from North America are Panamanian (12.9%, a difference of 0.010%), Moroccan (12.9%, a difference of 0.050%), Israeli (12.9%, a difference of 0.18%), Immigrants from West Indies (12.9%, a difference of 0.27%), and Immigrants from Switzerland (12.8%, a difference of 0.29%).
| Demographics | Rating | Rank | Single Male Poverty |
| Immigrants | St. Vincent and the Grenadines | 50.9 /100 | #173 | Average 12.8% |
| Costa Ricans | 50.0 /100 | #174 | Average 12.8% |
| Croatians | 48.9 /100 | #175 | Average 12.8% |
| Syrians | 48.4 /100 | #176 | Average 12.8% |
| Immigrants | Canada | 44.8 /100 | #177 | Average 12.8% |
| Immigrants | Switzerland | 43.1 /100 | #178 | Average 12.8% |
| Israelis | 41.0 /100 | #179 | Average 12.9% |
| Immigrants | North America | 37.7 /100 | #180 | Fair 12.9% |
| Panamanians | 37.6 /100 | #181 | Fair 12.9% |
| Moroccans | 36.8 /100 | #182 | Fair 12.9% |
| Immigrants | West Indies | 33.0 /100 | #183 | Fair 12.9% |
| Immigrants | Trinidad and Tobago | 32.5 /100 | #184 | Fair 12.9% |
| Norwegians | 32.0 /100 | #185 | Fair 12.9% |
| Nigerians | 31.9 /100 | #186 | Fair 12.9% |
| Immigrants | Kuwait | 31.9 /100 | #187 | Fair 12.9% |