Haitian vs Immigrants from North America Single Male Poverty
COMPARE
Haitian
Immigrants from North America
Single Male Poverty
Single Male Poverty Comparison
Haitians
Immigrants from North America
13.2%
SINGLE MALE POVERTY
7.0/ 100
METRIC RATING
227th/ 347
METRIC RANK
12.9%
SINGLE MALE POVERTY
37.7/ 100
METRIC RATING
180th/ 347
METRIC RANK
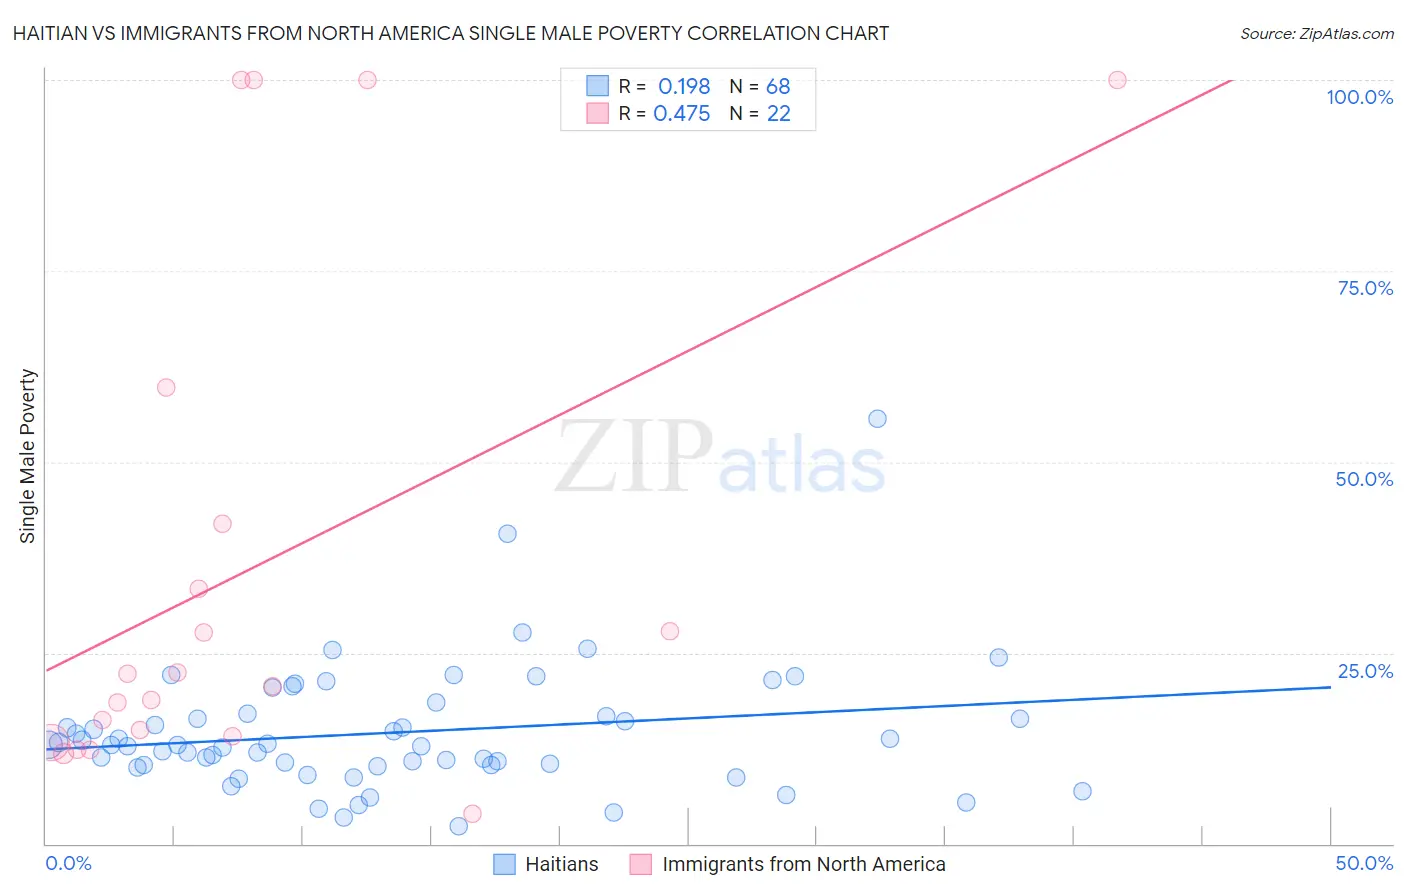
Haitian vs Immigrants from North America Single Male Poverty Correlation Chart
The statistical analysis conducted on geographies consisting of 262,577,789 people shows a poor positive correlation between the proportion of Haitians and poverty level among single males in the United States with a correlation coefficient (R) of 0.198 and weighted average of 13.2%. Similarly, the statistical analysis conducted on geographies consisting of 398,248,842 people shows a moderate positive correlation between the proportion of Immigrants from North America and poverty level among single males in the United States with a correlation coefficient (R) of 0.475 and weighted average of 12.9%, a difference of 2.7%.
Single Male Poverty Correlation Summary
| Measurement | Haitian | Immigrants from North America |
| Minimum | 2.3% | 4.0% |
| Maximum | 55.7% | 100.0% |
| Range | 53.4% | 96.0% |
| Mean | 14.5% | 36.0% |
| Median | 12.9% | 21.5% |
| Interquartile 25% (IQ1) | 10.3% | 14.1% |
| Interquartile 75% (IQ3) | 16.9% | 41.9% |
| Interquartile Range (IQR) | 6.6% | 27.8% |
| Standard Deviation (Sample) | 8.3% | 33.0% |
| Standard Deviation (Population) | 8.2% | 32.3% |
Similar Demographics by Single Male Poverty
Demographics Similar to Haitians by Single Male Poverty
In terms of single male poverty, the demographic groups most similar to Haitians are Lebanese (13.2%, a difference of 0.080%), Jamaican (13.2%, a difference of 0.13%), European (13.3%, a difference of 0.17%), Ghanaian (13.3%, a difference of 0.20%), and Immigrants from Denmark (13.2%, a difference of 0.30%).
| Demographics | Rating | Rank | Single Male Poverty |
| Central Americans | 10.9 /100 | #220 | Poor 13.2% |
| New Zealanders | 10.7 /100 | #221 | Poor 13.2% |
| Immigrants | Western Europe | 10.0 /100 | #222 | Poor 13.2% |
| Immigrants | Azores | 9.3 /100 | #223 | Tragic 13.2% |
| Somalis | 9.1 /100 | #224 | Tragic 13.2% |
| Immigrants | Denmark | 8.7 /100 | #225 | Tragic 13.2% |
| Jamaicans | 7.7 /100 | #226 | Tragic 13.2% |
| Haitians | 7.0 /100 | #227 | Tragic 13.2% |
| Lebanese | 6.6 /100 | #228 | Tragic 13.2% |
| Europeans | 6.2 /100 | #229 | Tragic 13.3% |
| Ghanaians | 6.1 /100 | #230 | Tragic 13.3% |
| Slavs | 5.3 /100 | #231 | Tragic 13.3% |
| Immigrants | Caribbean | 5.0 /100 | #232 | Tragic 13.3% |
| British | 4.0 /100 | #233 | Tragic 13.3% |
| Canadians | 4.0 /100 | #234 | Tragic 13.3% |
Demographics Similar to Immigrants from North America by Single Male Poverty
In terms of single male poverty, the demographic groups most similar to Immigrants from North America are Panamanian (12.9%, a difference of 0.010%), Moroccan (12.9%, a difference of 0.050%), Israeli (12.9%, a difference of 0.18%), Immigrants from West Indies (12.9%, a difference of 0.27%), and Immigrants from Switzerland (12.8%, a difference of 0.29%).
| Demographics | Rating | Rank | Single Male Poverty |
| Immigrants | St. Vincent and the Grenadines | 50.9 /100 | #173 | Average 12.8% |
| Costa Ricans | 50.0 /100 | #174 | Average 12.8% |
| Croatians | 48.9 /100 | #175 | Average 12.8% |
| Syrians | 48.4 /100 | #176 | Average 12.8% |
| Immigrants | Canada | 44.8 /100 | #177 | Average 12.8% |
| Immigrants | Switzerland | 43.1 /100 | #178 | Average 12.8% |
| Israelis | 41.0 /100 | #179 | Average 12.9% |
| Immigrants | North America | 37.7 /100 | #180 | Fair 12.9% |
| Panamanians | 37.6 /100 | #181 | Fair 12.9% |
| Moroccans | 36.8 /100 | #182 | Fair 12.9% |
| Immigrants | West Indies | 33.0 /100 | #183 | Fair 12.9% |
| Immigrants | Trinidad and Tobago | 32.5 /100 | #184 | Fair 12.9% |
| Norwegians | 32.0 /100 | #185 | Fair 12.9% |
| Nigerians | 31.9 /100 | #186 | Fair 12.9% |
| Immigrants | Kuwait | 31.9 /100 | #187 | Fair 12.9% |