Immigrants from Afghanistan vs Immigrants from Chile Single Mother Poverty
COMPARE
Immigrants from Afghanistan
Immigrants from Chile
Single Mother Poverty
Single Mother Poverty Comparison
Immigrants from Afghanistan
Immigrants from Chile
28.3%
SINGLE MOTHER POVERTY
92.1/ 100
METRIC RATING
121st/ 347
METRIC RANK
28.4%
SINGLE MOTHER POVERTY
90.8/ 100
METRIC RATING
126th/ 347
METRIC RANK
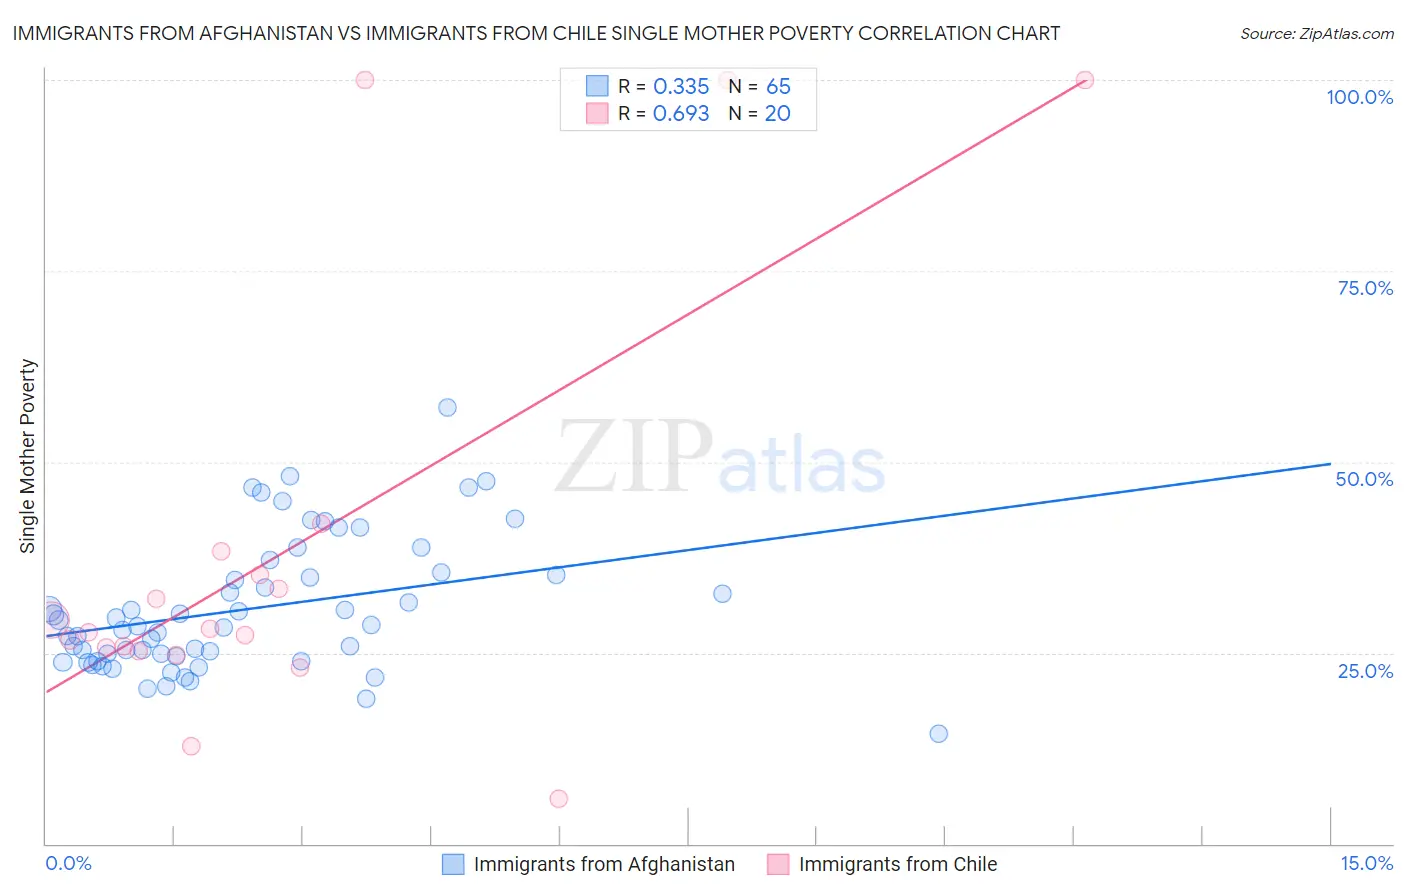
Immigrants from Afghanistan vs Immigrants from Chile Single Mother Poverty Correlation Chart
The statistical analysis conducted on geographies consisting of 145,984,259 people shows a mild positive correlation between the proportion of Immigrants from Afghanistan and poverty level among single mothers in the United States with a correlation coefficient (R) of 0.335 and weighted average of 28.3%. Similarly, the statistical analysis conducted on geographies consisting of 215,689,782 people shows a significant positive correlation between the proportion of Immigrants from Chile and poverty level among single mothers in the United States with a correlation coefficient (R) of 0.693 and weighted average of 28.4%, a difference of 0.19%.
Single Mother Poverty Correlation Summary
| Measurement | Immigrants from Afghanistan | Immigrants from Chile |
| Minimum | 14.5% | 5.9% |
| Maximum | 57.2% | 100.0% |
| Range | 42.7% | 94.1% |
| Mean | 30.7% | 38.1% |
| Median | 28.4% | 27.9% |
| Interquartile 25% (IQ1) | 24.2% | 25.4% |
| Interquartile 75% (IQ3) | 35.4% | 36.7% |
| Interquartile Range (IQR) | 11.1% | 11.3% |
| Standard Deviation (Sample) | 8.7% | 27.8% |
| Standard Deviation (Population) | 8.6% | 27.1% |
Demographics Similar to Immigrants from Afghanistan and Immigrants from Chile by Single Mother Poverty
In terms of single mother poverty, the demographic groups most similar to Immigrants from Afghanistan are Cypriot (28.3%, a difference of 0.040%), Immigrants from Syria (28.3%, a difference of 0.050%), Colombian (28.3%, a difference of 0.050%), Uruguayan (28.3%, a difference of 0.060%), and Immigrants from Switzerland (28.3%, a difference of 0.060%). Similarly, the demographic groups most similar to Immigrants from Chile are Kenyan (28.4%, a difference of 0.010%), Polish (28.4%, a difference of 0.010%), Immigrants from England (28.4%, a difference of 0.040%), South American (28.4%, a difference of 0.070%), and Norwegian (28.4%, a difference of 0.070%).
| Demographics | Rating | Rank | Single Mother Poverty |
| Immigrants | South Africa | 93.2 /100 | #113 | Exceptional 28.3% |
| Immigrants | Western Asia | 92.7 /100 | #114 | Exceptional 28.3% |
| Immigrants | Kuwait | 92.7 /100 | #115 | Exceptional 28.3% |
| Immigrants | Uganda | 92.5 /100 | #116 | Exceptional 28.3% |
| Australians | 92.5 /100 | #117 | Exceptional 28.3% |
| Brazilians | 92.4 /100 | #118 | Exceptional 28.3% |
| Immigrants | Syria | 92.4 /100 | #119 | Exceptional 28.3% |
| Cypriots | 92.3 /100 | #120 | Exceptional 28.3% |
| Immigrants | Afghanistan | 92.1 /100 | #121 | Exceptional 28.3% |
| Colombians | 91.8 /100 | #122 | Exceptional 28.3% |
| Uruguayans | 91.7 /100 | #123 | Exceptional 28.3% |
| Immigrants | Switzerland | 91.7 /100 | #124 | Exceptional 28.3% |
| Kenyans | 90.9 /100 | #125 | Exceptional 28.4% |
| Immigrants | Chile | 90.8 /100 | #126 | Exceptional 28.4% |
| Poles | 90.8 /100 | #127 | Exceptional 28.4% |
| Immigrants | England | 90.5 /100 | #128 | Exceptional 28.4% |
| South Americans | 90.4 /100 | #129 | Exceptional 28.4% |
| Norwegians | 90.4 /100 | #130 | Exceptional 28.4% |
| Immigrants | Austria | 90.3 /100 | #131 | Exceptional 28.4% |
| Immigrants | Morocco | 89.5 /100 | #132 | Excellent 28.4% |
| Swedes | 89.4 /100 | #133 | Excellent 28.4% |