Immigrants from Eritrea vs Arab Male Poverty
COMPARE
Immigrants from Eritrea
Arab
Male Poverty
Male Poverty Comparison
Immigrants from Eritrea
Arabs
12.2%
MALE POVERTY
2.4/ 100
METRIC RATING
220th/ 347
METRIC RANK
11.6%
MALE POVERTY
15.8/ 100
METRIC RATING
195th/ 347
METRIC RANK
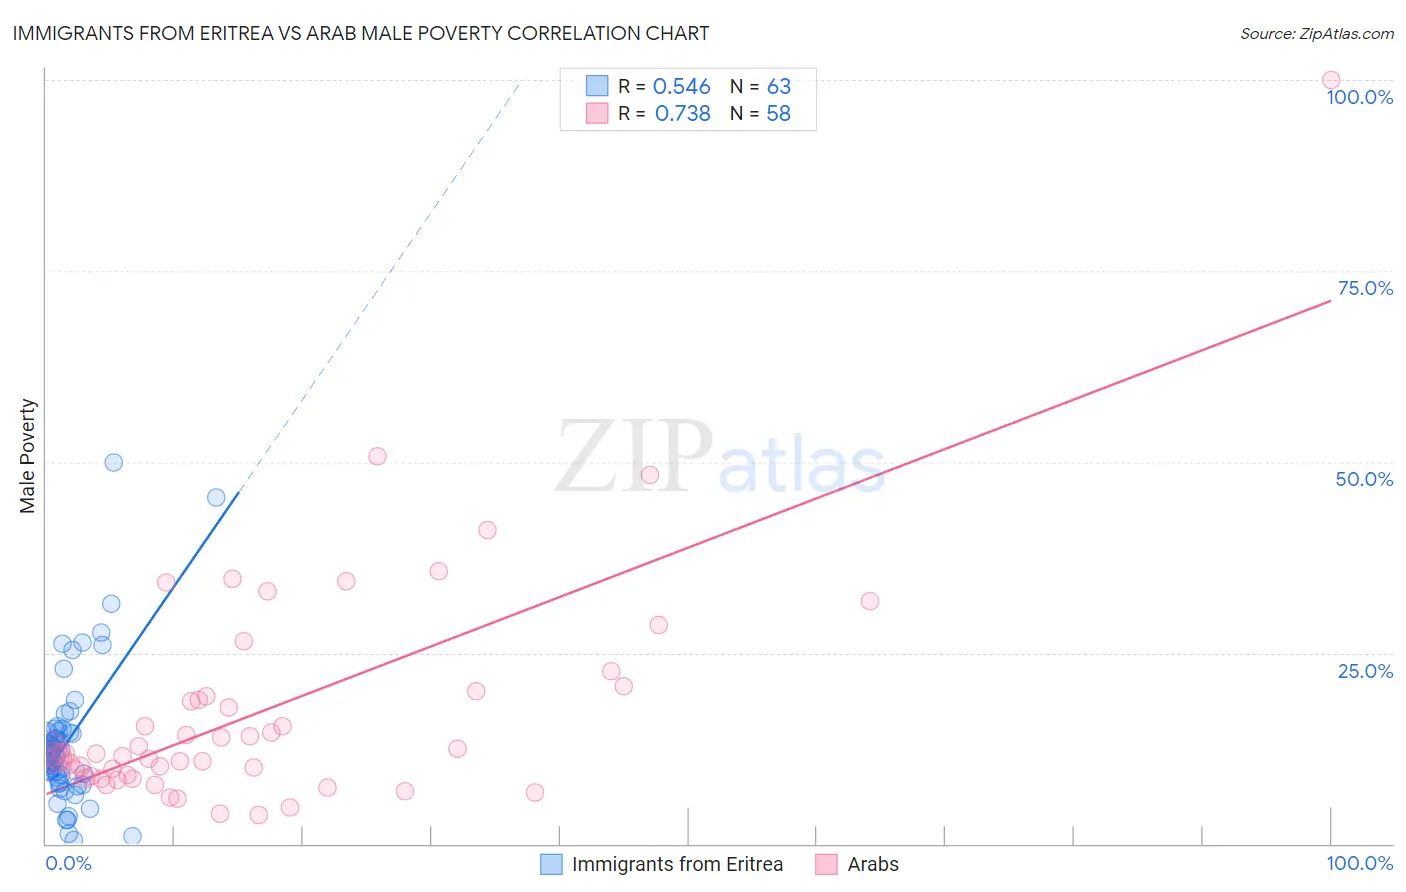
Immigrants from Eritrea vs Arab Male Poverty Correlation Chart
The statistical analysis conducted on geographies consisting of 104,841,336 people shows a substantial positive correlation between the proportion of Immigrants from Eritrea and poverty level among males in the United States with a correlation coefficient (R) of 0.546 and weighted average of 12.2%. Similarly, the statistical analysis conducted on geographies consisting of 486,080,100 people shows a strong positive correlation between the proportion of Arabs and poverty level among males in the United States with a correlation coefficient (R) of 0.738 and weighted average of 11.6%, a difference of 4.8%.
Male Poverty Correlation Summary
| Measurement | Immigrants from Eritrea | Arab |
| Minimum | 0.53% | 3.8% |
| Maximum | 50.0% | 100.0% |
| Range | 49.5% | 96.2% |
| Mean | 13.4% | 17.7% |
| Median | 12.0% | 11.7% |
| Interquartile 25% (IQ1) | 8.6% | 8.8% |
| Interquartile 75% (IQ3) | 14.7% | 20.0% |
| Interquartile Range (IQR) | 6.1% | 11.2% |
| Standard Deviation (Sample) | 9.0% | 15.6% |
| Standard Deviation (Population) | 9.0% | 15.5% |
Similar Demographics by Male Poverty
Demographics Similar to Immigrants from Eritrea by Male Poverty
In terms of male poverty, the demographic groups most similar to Immigrants from Eritrea are Bermudan (12.2%, a difference of 0.020%), German Russian (12.2%, a difference of 0.080%), Immigrants from Thailand (12.2%, a difference of 0.11%), Immigrants from Cambodia (12.2%, a difference of 0.12%), and Immigrants from Uzbekistan (12.2%, a difference of 0.20%).
| Demographics | Rating | Rank | Male Poverty |
| Immigrants | Nonimmigrants | 3.1 /100 | #213 | Tragic 12.1% |
| Japanese | 2.7 /100 | #214 | Tragic 12.2% |
| Immigrants | Uzbekistan | 2.6 /100 | #215 | Tragic 12.2% |
| Immigrants | Cambodia | 2.5 /100 | #216 | Tragic 12.2% |
| Immigrants | Thailand | 2.5 /100 | #217 | Tragic 12.2% |
| German Russians | 2.5 /100 | #218 | Tragic 12.2% |
| Bermudans | 2.4 /100 | #219 | Tragic 12.2% |
| Immigrants | Eritrea | 2.4 /100 | #220 | Tragic 12.2% |
| Ugandans | 2.2 /100 | #221 | Tragic 12.2% |
| Immigrants | Africa | 2.1 /100 | #222 | Tragic 12.2% |
| Immigrants | Micronesia | 2.1 /100 | #223 | Tragic 12.2% |
| Immigrants | Nigeria | 1.6 /100 | #224 | Tragic 12.3% |
| Osage | 1.5 /100 | #225 | Tragic 12.3% |
| Nigerians | 1.4 /100 | #226 | Tragic 12.3% |
| Alaska Natives | 1.4 /100 | #227 | Tragic 12.4% |
Demographics Similar to Arabs by Male Poverty
In terms of male poverty, the demographic groups most similar to Arabs are Hmong (11.6%, a difference of 0.010%), Immigrants from Kenya (11.6%, a difference of 0.050%), Delaware (11.7%, a difference of 0.070%), Iraqi (11.7%, a difference of 0.21%), and Immigrants from Kuwait (11.6%, a difference of 0.26%).
| Demographics | Rating | Rank | Male Poverty |
| Sierra Leoneans | 29.9 /100 | #188 | Fair 11.4% |
| Hawaiians | 28.3 /100 | #189 | Fair 11.4% |
| Israelis | 26.1 /100 | #190 | Fair 11.5% |
| South American Indians | 22.8 /100 | #191 | Fair 11.5% |
| Immigrants | Uruguay | 19.1 /100 | #192 | Poor 11.6% |
| Immigrants | Kuwait | 17.3 /100 | #193 | Poor 11.6% |
| Immigrants | Kenya | 16.1 /100 | #194 | Poor 11.6% |
| Arabs | 15.8 /100 | #195 | Poor 11.6% |
| Hmong | 15.8 /100 | #196 | Poor 11.6% |
| Delaware | 15.4 /100 | #197 | Poor 11.7% |
| Iraqis | 14.7 /100 | #198 | Poor 11.7% |
| Spanish | 14.1 /100 | #199 | Poor 11.7% |
| Immigrants | Lebanon | 13.6 /100 | #200 | Poor 11.7% |
| Spaniards | 13.5 /100 | #201 | Poor 11.7% |
| Aleuts | 10.4 /100 | #202 | Poor 11.8% |