Immigrants from Lithuania vs Arab Male Poverty
COMPARE
Immigrants from Lithuania
Arab
Male Poverty
Male Poverty Comparison
Immigrants from Lithuania
Arabs
9.4%
MALE POVERTY
99.9/ 100
METRIC RATING
13th/ 347
METRIC RANK
11.6%
MALE POVERTY
15.8/ 100
METRIC RATING
195th/ 347
METRIC RANK
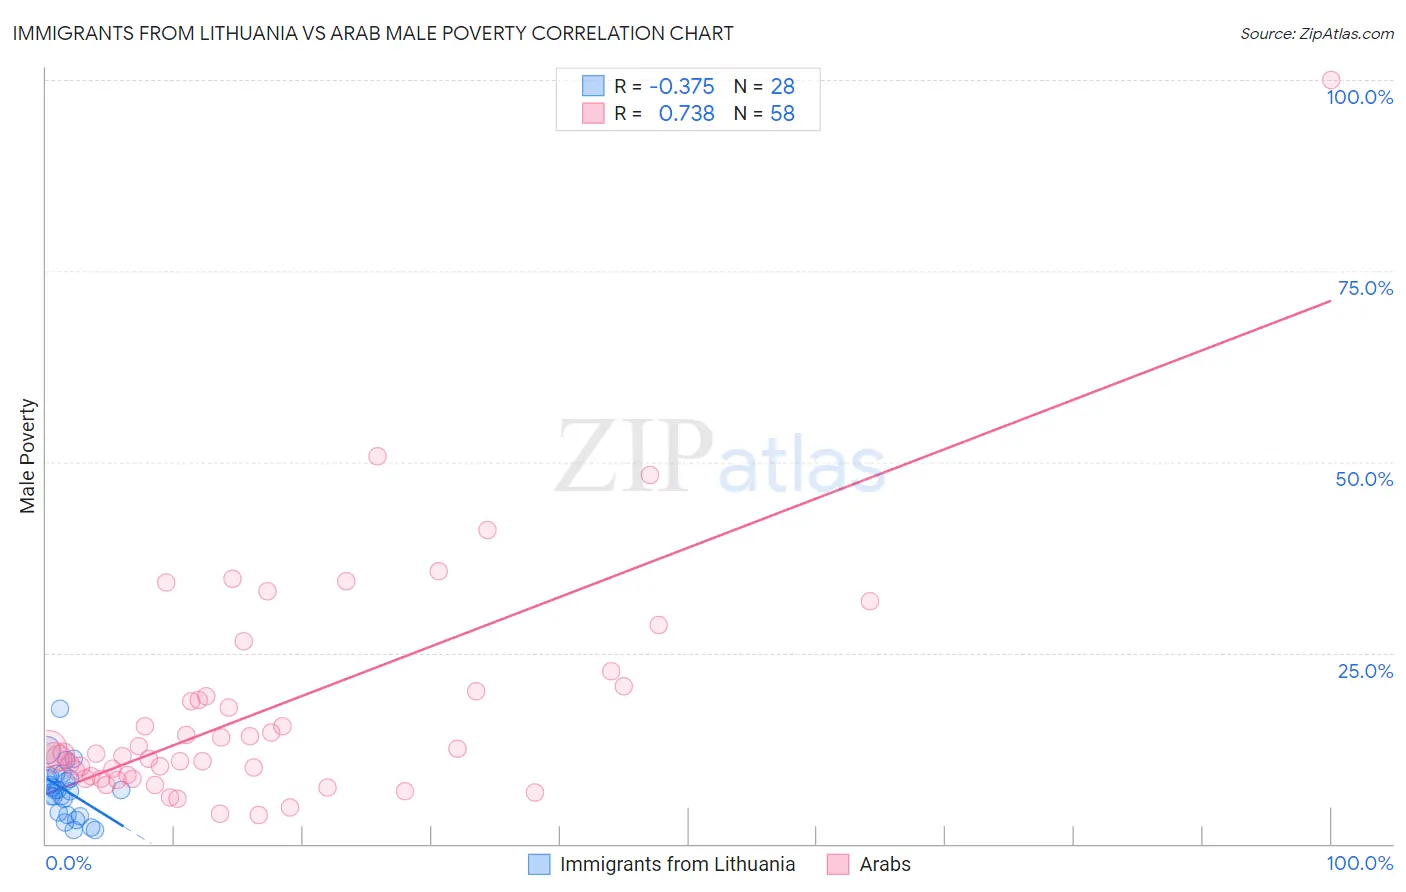
Immigrants from Lithuania vs Arab Male Poverty Correlation Chart
The statistical analysis conducted on geographies consisting of 117,705,146 people shows a mild negative correlation between the proportion of Immigrants from Lithuania and poverty level among males in the United States with a correlation coefficient (R) of -0.375 and weighted average of 9.4%. Similarly, the statistical analysis conducted on geographies consisting of 486,080,100 people shows a strong positive correlation between the proportion of Arabs and poverty level among males in the United States with a correlation coefficient (R) of 0.738 and weighted average of 11.6%, a difference of 23.9%.
Male Poverty Correlation Summary
| Measurement | Immigrants from Lithuania | Arab |
| Minimum | 1.8% | 3.8% |
| Maximum | 17.6% | 100.0% |
| Range | 15.8% | 96.2% |
| Mean | 7.0% | 17.7% |
| Median | 7.0% | 11.7% |
| Interquartile 25% (IQ1) | 3.9% | 8.8% |
| Interquartile 75% (IQ3) | 8.7% | 20.0% |
| Interquartile Range (IQR) | 4.8% | 11.2% |
| Standard Deviation (Sample) | 3.5% | 15.6% |
| Standard Deviation (Population) | 3.5% | 15.5% |
Similar Demographics by Male Poverty
Demographics Similar to Immigrants from Lithuania by Male Poverty
In terms of male poverty, the demographic groups most similar to Immigrants from Lithuania are Immigrants from Bolivia (9.4%, a difference of 0.12%), Bolivian (9.4%, a difference of 0.17%), Immigrants from North Macedonia (9.4%, a difference of 0.38%), Bhutanese (9.5%, a difference of 0.67%), and Bulgarian (9.3%, a difference of 0.82%).
| Demographics | Rating | Rank | Male Poverty |
| Assyrians/Chaldeans/Syriacs | 99.9 /100 | #6 | Exceptional 9.1% |
| Immigrants | Ireland | 99.9 /100 | #7 | Exceptional 9.1% |
| Filipinos | 99.9 /100 | #8 | Exceptional 9.2% |
| Immigrants | South Central Asia | 99.9 /100 | #9 | Exceptional 9.3% |
| Bulgarians | 99.9 /100 | #10 | Exceptional 9.3% |
| Bolivians | 99.9 /100 | #11 | Exceptional 9.4% |
| Immigrants | Bolivia | 99.9 /100 | #12 | Exceptional 9.4% |
| Immigrants | Lithuania | 99.9 /100 | #13 | Exceptional 9.4% |
| Immigrants | North Macedonia | 99.8 /100 | #14 | Exceptional 9.4% |
| Bhutanese | 99.8 /100 | #15 | Exceptional 9.5% |
| Luxembourgers | 99.8 /100 | #16 | Exceptional 9.5% |
| Norwegians | 99.8 /100 | #17 | Exceptional 9.5% |
| Lithuanians | 99.8 /100 | #18 | Exceptional 9.5% |
| Immigrants | Hong Kong | 99.7 /100 | #19 | Exceptional 9.6% |
| Latvians | 99.7 /100 | #20 | Exceptional 9.6% |
Demographics Similar to Arabs by Male Poverty
In terms of male poverty, the demographic groups most similar to Arabs are Hmong (11.6%, a difference of 0.010%), Immigrants from Kenya (11.6%, a difference of 0.050%), Delaware (11.7%, a difference of 0.070%), Iraqi (11.7%, a difference of 0.21%), and Immigrants from Kuwait (11.6%, a difference of 0.26%).
| Demographics | Rating | Rank | Male Poverty |
| Sierra Leoneans | 29.9 /100 | #188 | Fair 11.4% |
| Hawaiians | 28.3 /100 | #189 | Fair 11.4% |
| Israelis | 26.1 /100 | #190 | Fair 11.5% |
| South American Indians | 22.8 /100 | #191 | Fair 11.5% |
| Immigrants | Uruguay | 19.1 /100 | #192 | Poor 11.6% |
| Immigrants | Kuwait | 17.3 /100 | #193 | Poor 11.6% |
| Immigrants | Kenya | 16.1 /100 | #194 | Poor 11.6% |
| Arabs | 15.8 /100 | #195 | Poor 11.6% |
| Hmong | 15.8 /100 | #196 | Poor 11.6% |
| Delaware | 15.4 /100 | #197 | Poor 11.7% |
| Iraqis | 14.7 /100 | #198 | Poor 11.7% |
| Spanish | 14.1 /100 | #199 | Poor 11.7% |
| Immigrants | Lebanon | 13.6 /100 | #200 | Poor 11.7% |
| Spaniards | 13.5 /100 | #201 | Poor 11.7% |
| Aleuts | 10.4 /100 | #202 | Poor 11.8% |