Yakama vs Senegalese Female Poverty Among 25-34 Year Olds
COMPARE
Yakama
Senegalese
Female Poverty Among 25-34 Year Olds
Female Poverty Among 25-34 Year Olds Comparison
Yakama
Senegalese
17.6%
FEMALE POVERTY AMONG 25-34 YEAR OLDS
0.0/ 100
METRIC RATING
315th/ 347
METRIC RANK
15.6%
FEMALE POVERTY AMONG 25-34 YEAR OLDS
0.1/ 100
METRIC RATING
272nd/ 347
METRIC RANK
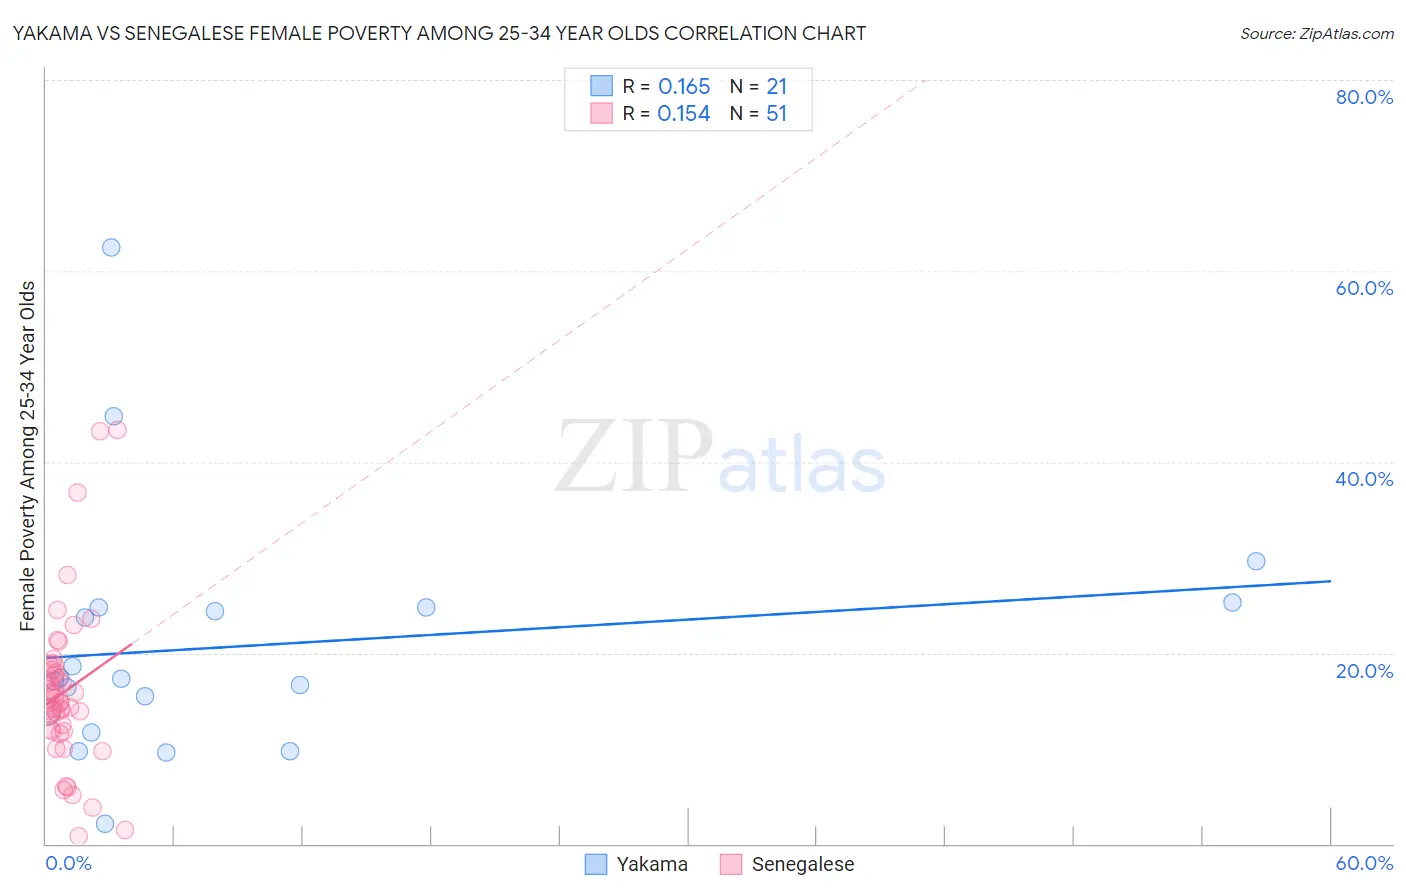
Yakama vs Senegalese Female Poverty Among 25-34 Year Olds Correlation Chart
The statistical analysis conducted on geographies consisting of 19,834,857 people shows a poor positive correlation between the proportion of Yakama and poverty level among females between the ages 25 and 34 in the United States with a correlation coefficient (R) of 0.165 and weighted average of 17.6%. Similarly, the statistical analysis conducted on geographies consisting of 77,949,364 people shows a poor positive correlation between the proportion of Senegalese and poverty level among females between the ages 25 and 34 in the United States with a correlation coefficient (R) of 0.154 and weighted average of 15.6%, a difference of 12.8%.
Female Poverty Among 25-34 Year Olds Correlation Summary
| Measurement | Yakama | Senegalese |
| Minimum | 2.1% | 0.82% |
| Maximum | 62.5% | 43.4% |
| Range | 60.4% | 42.6% |
| Mean | 20.7% | 15.9% |
| Median | 17.2% | 14.8% |
| Interquartile 25% (IQ1) | 12.8% | 11.8% |
| Interquartile 75% (IQ3) | 24.7% | 18.7% |
| Interquartile Range (IQR) | 12.0% | 6.9% |
| Standard Deviation (Sample) | 13.1% | 8.5% |
| Standard Deviation (Population) | 12.8% | 8.4% |
Similar Demographics by Female Poverty Among 25-34 Year Olds
Demographics Similar to Yakama by Female Poverty Among 25-34 Year Olds
In terms of female poverty among 25-34 year olds, the demographic groups most similar to Yakama are Dominican (17.6%, a difference of 0.0%), Immigrants from Dominican Republic (17.6%, a difference of 0.22%), Arapaho (17.8%, a difference of 0.79%), Colville (17.5%, a difference of 0.90%), and Iroquois (17.5%, a difference of 0.98%).
| Demographics | Rating | Rank | Female Poverty Among 25-34 Year Olds |
| Africans | 0.0 /100 | #308 | Tragic 17.0% |
| Ottawa | 0.0 /100 | #309 | Tragic 17.1% |
| Cherokee | 0.0 /100 | #310 | Tragic 17.2% |
| Immigrants | Honduras | 0.0 /100 | #311 | Tragic 17.3% |
| Iroquois | 0.0 /100 | #312 | Tragic 17.5% |
| Colville | 0.0 /100 | #313 | Tragic 17.5% |
| Immigrants | Dominican Republic | 0.0 /100 | #314 | Tragic 17.6% |
| Yakama | 0.0 /100 | #315 | Tragic 17.6% |
| Dominicans | 0.0 /100 | #316 | Tragic 17.6% |
| Arapaho | 0.0 /100 | #317 | Tragic 17.8% |
| Ute | 0.0 /100 | #318 | Tragic 17.9% |
| Menominee | 0.0 /100 | #319 | Tragic 18.0% |
| Chippewa | 0.0 /100 | #320 | Tragic 18.0% |
| Choctaw | 0.0 /100 | #321 | Tragic 18.1% |
| Central American Indians | 0.0 /100 | #322 | Tragic 18.2% |
Demographics Similar to Senegalese by Female Poverty Among 25-34 Year Olds
In terms of female poverty among 25-34 year olds, the demographic groups most similar to Senegalese are Cree (15.6%, a difference of 0.060%), British West Indian (15.6%, a difference of 0.070%), Nonimmigrants (15.6%, a difference of 0.11%), Subsaharan African (15.6%, a difference of 0.22%), and Immigrants from Senegal (15.6%, a difference of 0.44%).
| Demographics | Rating | Rank | Female Poverty Among 25-34 Year Olds |
| Immigrants | Liberia | 0.1 /100 | #265 | Tragic 15.4% |
| Immigrants | Somalia | 0.1 /100 | #266 | Tragic 15.4% |
| Central Americans | 0.1 /100 | #267 | Tragic 15.5% |
| Immigrants | Senegal | 0.1 /100 | #268 | Tragic 15.6% |
| Sub-Saharan Africans | 0.1 /100 | #269 | Tragic 15.6% |
| British West Indians | 0.1 /100 | #270 | Tragic 15.6% |
| Cree | 0.1 /100 | #271 | Tragic 15.6% |
| Senegalese | 0.1 /100 | #272 | Tragic 15.6% |
| Immigrants | Nonimmigrants | 0.1 /100 | #273 | Tragic 15.6% |
| Immigrants | Caribbean | 0.0 /100 | #274 | Tragic 15.7% |
| Immigrants | Azores | 0.0 /100 | #275 | Tragic 15.8% |
| Immigrants | Zaire | 0.0 /100 | #276 | Tragic 15.8% |
| Immigrants | Micronesia | 0.0 /100 | #277 | Tragic 15.8% |
| French American Indians | 0.0 /100 | #278 | Tragic 15.9% |
| Fijians | 0.0 /100 | #279 | Tragic 15.9% |