Fijian vs Senegalese Female Poverty Among 25-34 Year Olds
COMPARE
Fijian
Senegalese
Female Poverty Among 25-34 Year Olds
Female Poverty Among 25-34 Year Olds Comparison
Fijians
Senegalese
15.9%
FEMALE POVERTY AMONG 25-34 YEAR OLDS
0.0/ 100
METRIC RATING
279th/ 347
METRIC RANK
15.6%
FEMALE POVERTY AMONG 25-34 YEAR OLDS
0.1/ 100
METRIC RATING
272nd/ 347
METRIC RANK
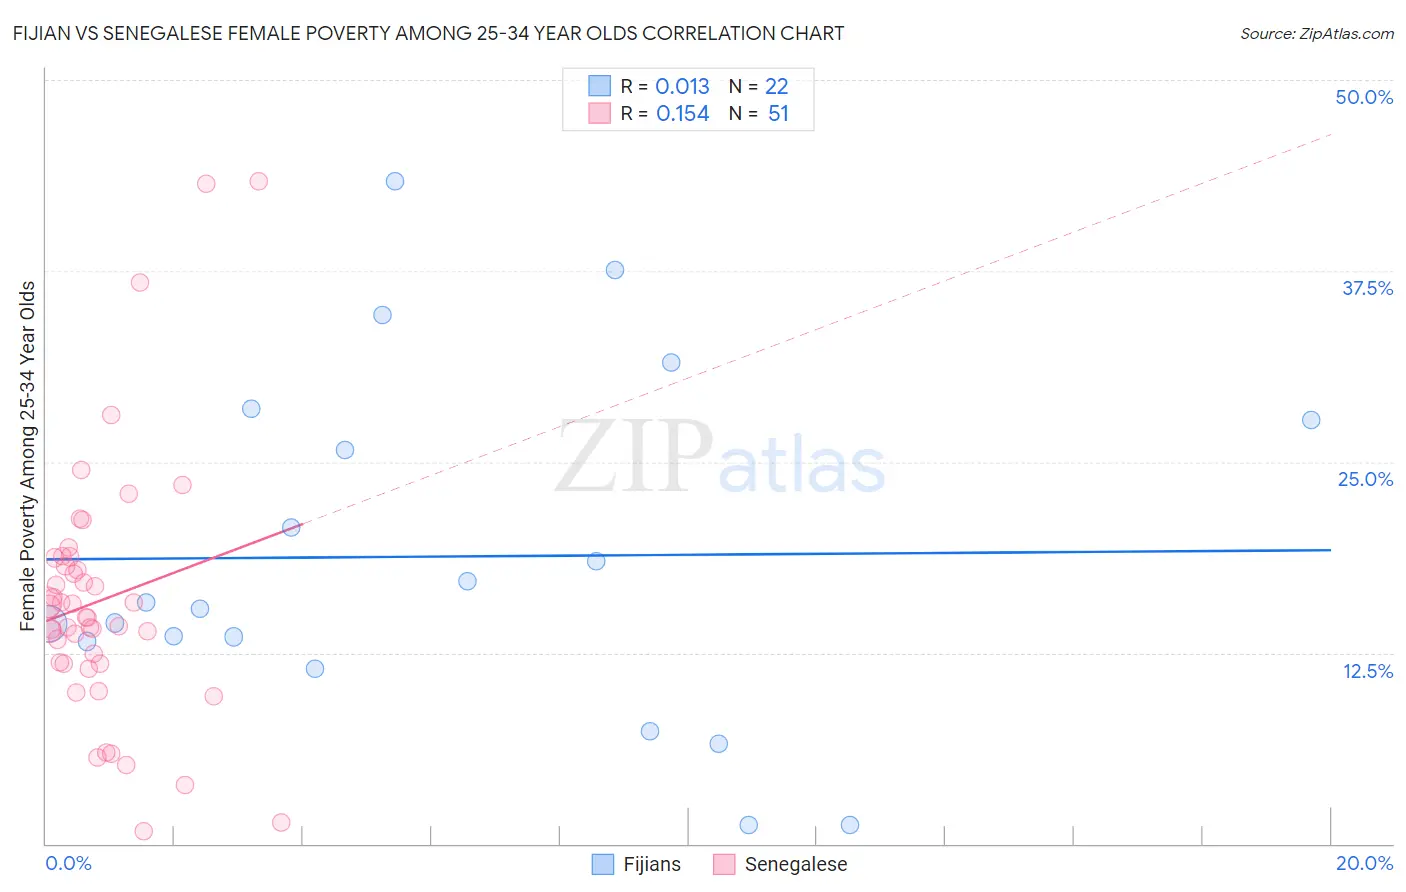
Fijian vs Senegalese Female Poverty Among 25-34 Year Olds Correlation Chart
The statistical analysis conducted on geographies consisting of 55,805,366 people shows no correlation between the proportion of Fijians and poverty level among females between the ages 25 and 34 in the United States with a correlation coefficient (R) of 0.013 and weighted average of 15.9%. Similarly, the statistical analysis conducted on geographies consisting of 77,949,364 people shows a poor positive correlation between the proportion of Senegalese and poverty level among females between the ages 25 and 34 in the United States with a correlation coefficient (R) of 0.154 and weighted average of 15.6%, a difference of 1.7%.
Female Poverty Among 25-34 Year Olds Correlation Summary
| Measurement | Fijian | Senegalese |
| Minimum | 1.2% | 0.82% |
| Maximum | 43.3% | 43.4% |
| Range | 42.1% | 42.6% |
| Mean | 18.8% | 15.9% |
| Median | 15.6% | 14.8% |
| Interquartile 25% (IQ1) | 13.2% | 11.8% |
| Interquartile 75% (IQ3) | 27.8% | 18.7% |
| Interquartile Range (IQR) | 14.5% | 6.9% |
| Standard Deviation (Sample) | 11.3% | 8.5% |
| Standard Deviation (Population) | 11.1% | 8.4% |
Demographics Similar to Fijians and Senegalese by Female Poverty Among 25-34 Year Olds
In terms of female poverty among 25-34 year olds, the demographic groups most similar to Fijians are French American Indian (15.9%, a difference of 0.0%), Bangladeshi (15.9%, a difference of 0.16%), Immigrants from Micronesia (15.8%, a difference of 0.29%), Immigrants from Zaire (15.8%, a difference of 0.30%), and Immigrants from Latin America (16.0%, a difference of 0.67%). Similarly, the demographic groups most similar to Senegalese are Cree (15.6%, a difference of 0.060%), British West Indian (15.6%, a difference of 0.070%), Nonimmigrants (15.6%, a difference of 0.11%), Subsaharan African (15.6%, a difference of 0.22%), and Immigrants from Senegal (15.6%, a difference of 0.44%).
| Demographics | Rating | Rank | Female Poverty Among 25-34 Year Olds |
| Immigrants | Liberia | 0.1 /100 | #265 | Tragic 15.4% |
| Immigrants | Somalia | 0.1 /100 | #266 | Tragic 15.4% |
| Central Americans | 0.1 /100 | #267 | Tragic 15.5% |
| Immigrants | Senegal | 0.1 /100 | #268 | Tragic 15.6% |
| Sub-Saharan Africans | 0.1 /100 | #269 | Tragic 15.6% |
| British West Indians | 0.1 /100 | #270 | Tragic 15.6% |
| Cree | 0.1 /100 | #271 | Tragic 15.6% |
| Senegalese | 0.1 /100 | #272 | Tragic 15.6% |
| Immigrants | Nonimmigrants | 0.1 /100 | #273 | Tragic 15.6% |
| Immigrants | Caribbean | 0.0 /100 | #274 | Tragic 15.7% |
| Immigrants | Azores | 0.0 /100 | #275 | Tragic 15.8% |
| Immigrants | Zaire | 0.0 /100 | #276 | Tragic 15.8% |
| Immigrants | Micronesia | 0.0 /100 | #277 | Tragic 15.8% |
| French American Indians | 0.0 /100 | #278 | Tragic 15.9% |
| Fijians | 0.0 /100 | #279 | Tragic 15.9% |
| Bangladeshis | 0.0 /100 | #280 | Tragic 15.9% |
| Immigrants | Latin America | 0.0 /100 | #281 | Tragic 16.0% |
| Aleuts | 0.0 /100 | #282 | Tragic 16.1% |
| Bahamians | 0.0 /100 | #283 | Tragic 16.1% |
| Shoshone | 0.0 /100 | #284 | Tragic 16.2% |
| Immigrants | Bahamas | 0.0 /100 | #285 | Tragic 16.3% |