Immigrants from Belgium vs Senegalese Female Poverty Among 25-34 Year Olds
COMPARE
Immigrants from Belgium
Senegalese
Female Poverty Among 25-34 Year Olds
Female Poverty Among 25-34 Year Olds Comparison
Immigrants from Belgium
Senegalese
12.2%
FEMALE POVERTY AMONG 25-34 YEAR OLDS
99.1/ 100
METRIC RATING
70th/ 347
METRIC RANK
15.6%
FEMALE POVERTY AMONG 25-34 YEAR OLDS
0.1/ 100
METRIC RATING
272nd/ 347
METRIC RANK
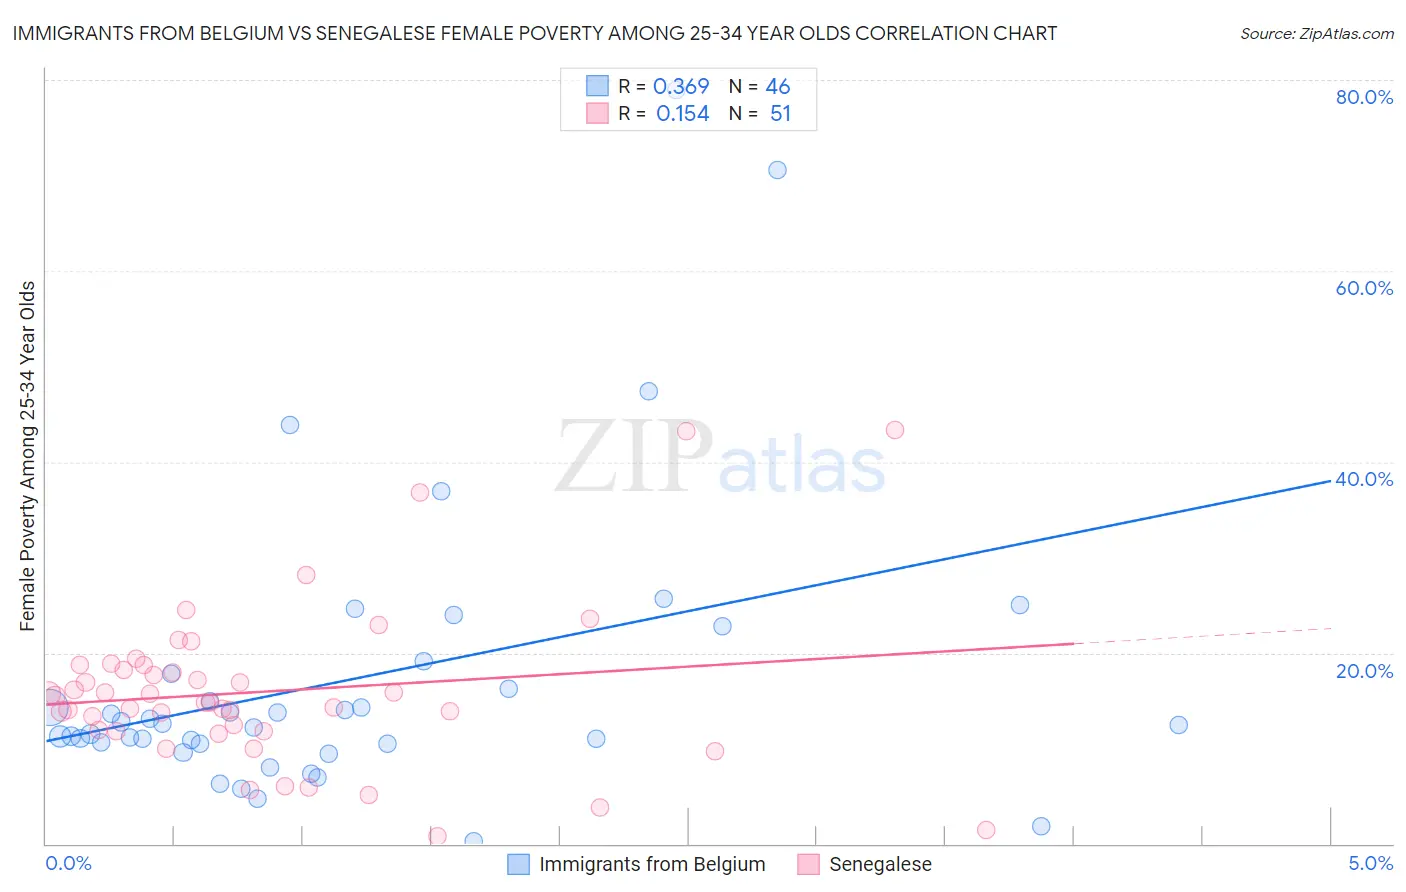
Immigrants from Belgium vs Senegalese Female Poverty Among 25-34 Year Olds Correlation Chart
The statistical analysis conducted on geographies consisting of 145,280,017 people shows a mild positive correlation between the proportion of Immigrants from Belgium and poverty level among females between the ages 25 and 34 in the United States with a correlation coefficient (R) of 0.369 and weighted average of 12.2%. Similarly, the statistical analysis conducted on geographies consisting of 77,949,364 people shows a poor positive correlation between the proportion of Senegalese and poverty level among females between the ages 25 and 34 in the United States with a correlation coefficient (R) of 0.154 and weighted average of 15.6%, a difference of 27.9%.
Female Poverty Among 25-34 Year Olds Correlation Summary
| Measurement | Immigrants from Belgium | Senegalese |
| Minimum | 0.28% | 0.82% |
| Maximum | 78.9% | 43.4% |
| Range | 78.7% | 42.6% |
| Mean | 17.3% | 15.9% |
| Median | 12.5% | 14.8% |
| Interquartile 25% (IQ1) | 10.5% | 11.8% |
| Interquartile 75% (IQ3) | 17.8% | 18.7% |
| Interquartile Range (IQR) | 7.3% | 6.9% |
| Standard Deviation (Sample) | 15.5% | 8.5% |
| Standard Deviation (Population) | 15.4% | 8.4% |
Similar Demographics by Female Poverty Among 25-34 Year Olds
Demographics Similar to Immigrants from Belgium by Female Poverty Among 25-34 Year Olds
In terms of female poverty among 25-34 year olds, the demographic groups most similar to Immigrants from Belgium are Immigrants from Scotland (12.2%, a difference of 0.010%), Immigrants from Lebanon (12.2%, a difference of 0.030%), Sri Lankan (12.2%, a difference of 0.060%), Lithuanian (12.2%, a difference of 0.060%), and Laotian (12.2%, a difference of 0.26%).
| Demographics | Rating | Rank | Female Poverty Among 25-34 Year Olds |
| Soviet Union | 99.3 /100 | #63 | Exceptional 12.1% |
| Immigrants | Russia | 99.2 /100 | #64 | Exceptional 12.2% |
| Armenians | 99.2 /100 | #65 | Exceptional 12.2% |
| Immigrants | Europe | 99.2 /100 | #66 | Exceptional 12.2% |
| Laotians | 99.2 /100 | #67 | Exceptional 12.2% |
| Sri Lankans | 99.1 /100 | #68 | Exceptional 12.2% |
| Immigrants | Lebanon | 99.1 /100 | #69 | Exceptional 12.2% |
| Immigrants | Belgium | 99.1 /100 | #70 | Exceptional 12.2% |
| Immigrants | Scotland | 99.1 /100 | #71 | Exceptional 12.2% |
| Lithuanians | 99.1 /100 | #72 | Exceptional 12.2% |
| Immigrants | Vietnam | 98.9 /100 | #73 | Exceptional 12.3% |
| Immigrants | Sweden | 98.9 /100 | #74 | Exceptional 12.3% |
| Estonians | 98.9 /100 | #75 | Exceptional 12.3% |
| Greeks | 98.9 /100 | #76 | Exceptional 12.3% |
| Immigrants | Italy | 98.8 /100 | #77 | Exceptional 12.3% |
Demographics Similar to Senegalese by Female Poverty Among 25-34 Year Olds
In terms of female poverty among 25-34 year olds, the demographic groups most similar to Senegalese are Cree (15.6%, a difference of 0.060%), British West Indian (15.6%, a difference of 0.070%), Nonimmigrants (15.6%, a difference of 0.11%), Subsaharan African (15.6%, a difference of 0.22%), and Immigrants from Senegal (15.6%, a difference of 0.44%).
| Demographics | Rating | Rank | Female Poverty Among 25-34 Year Olds |
| Immigrants | Liberia | 0.1 /100 | #265 | Tragic 15.4% |
| Immigrants | Somalia | 0.1 /100 | #266 | Tragic 15.4% |
| Central Americans | 0.1 /100 | #267 | Tragic 15.5% |
| Immigrants | Senegal | 0.1 /100 | #268 | Tragic 15.6% |
| Sub-Saharan Africans | 0.1 /100 | #269 | Tragic 15.6% |
| British West Indians | 0.1 /100 | #270 | Tragic 15.6% |
| Cree | 0.1 /100 | #271 | Tragic 15.6% |
| Senegalese | 0.1 /100 | #272 | Tragic 15.6% |
| Immigrants | Nonimmigrants | 0.1 /100 | #273 | Tragic 15.6% |
| Immigrants | Caribbean | 0.0 /100 | #274 | Tragic 15.7% |
| Immigrants | Azores | 0.0 /100 | #275 | Tragic 15.8% |
| Immigrants | Zaire | 0.0 /100 | #276 | Tragic 15.8% |
| Immigrants | Micronesia | 0.0 /100 | #277 | Tragic 15.8% |
| French American Indians | 0.0 /100 | #278 | Tragic 15.9% |
| Fijians | 0.0 /100 | #279 | Tragic 15.9% |