Northern European vs Senegalese Female Poverty Among 25-34 Year Olds
COMPARE
Northern European
Senegalese
Female Poverty Among 25-34 Year Olds
Female Poverty Among 25-34 Year Olds Comparison
Northern Europeans
Senegalese
13.2%
FEMALE POVERTY AMONG 25-34 YEAR OLDS
73.7/ 100
METRIC RATING
153rd/ 347
METRIC RANK
15.6%
FEMALE POVERTY AMONG 25-34 YEAR OLDS
0.1/ 100
METRIC RATING
272nd/ 347
METRIC RANK
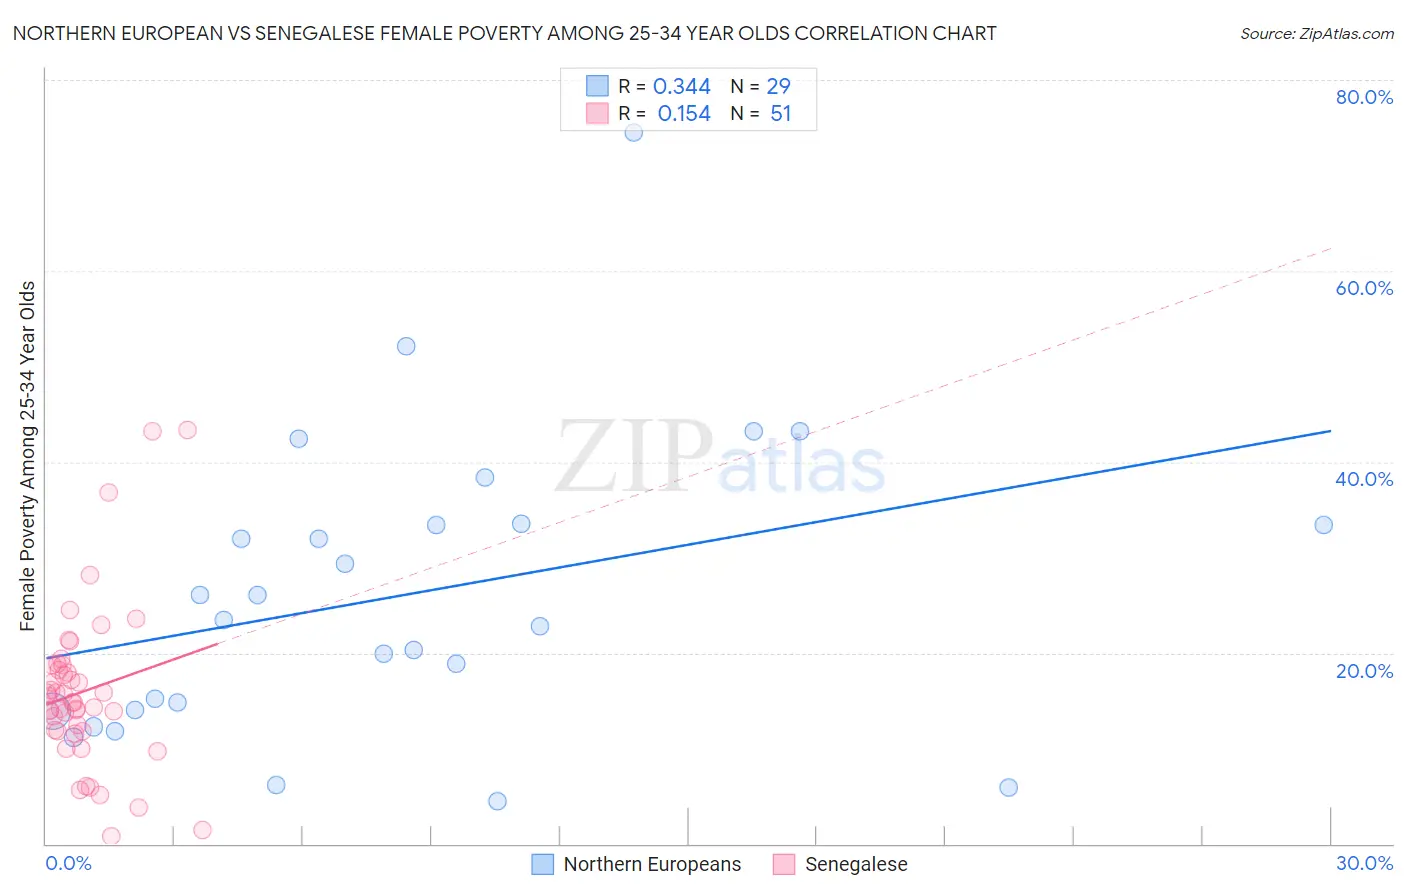
Northern European vs Senegalese Female Poverty Among 25-34 Year Olds Correlation Chart
The statistical analysis conducted on geographies consisting of 397,775,454 people shows a mild positive correlation between the proportion of Northern Europeans and poverty level among females between the ages 25 and 34 in the United States with a correlation coefficient (R) of 0.344 and weighted average of 13.2%. Similarly, the statistical analysis conducted on geographies consisting of 77,949,364 people shows a poor positive correlation between the proportion of Senegalese and poverty level among females between the ages 25 and 34 in the United States with a correlation coefficient (R) of 0.154 and weighted average of 15.6%, a difference of 17.9%.
Female Poverty Among 25-34 Year Olds Correlation Summary
| Measurement | Northern European | Senegalese |
| Minimum | 4.5% | 0.82% |
| Maximum | 74.5% | 43.4% |
| Range | 70.1% | 42.6% |
| Mean | 26.0% | 15.9% |
| Median | 23.5% | 14.8% |
| Interquartile 25% (IQ1) | 13.9% | 11.8% |
| Interquartile 75% (IQ3) | 33.4% | 18.7% |
| Interquartile Range (IQR) | 19.5% | 6.9% |
| Standard Deviation (Sample) | 15.6% | 8.5% |
| Standard Deviation (Population) | 15.4% | 8.4% |
Similar Demographics by Female Poverty Among 25-34 Year Olds
Demographics Similar to Northern Europeans by Female Poverty Among 25-34 Year Olds
In terms of female poverty among 25-34 year olds, the demographic groups most similar to Northern Europeans are Arab (13.2%, a difference of 0.020%), Immigrants from Sierra Leone (13.3%, a difference of 0.090%), Immigrants from Cameroon (13.3%, a difference of 0.18%), Slavic (13.2%, a difference of 0.23%), and Costa Rican (13.2%, a difference of 0.24%).
| Demographics | Rating | Rank | Female Poverty Among 25-34 Year Olds |
| South Americans | 76.9 /100 | #146 | Good 13.2% |
| Europeans | 76.8 /100 | #147 | Good 13.2% |
| Lebanese | 76.8 /100 | #148 | Good 13.2% |
| Sierra Leoneans | 76.3 /100 | #149 | Good 13.2% |
| Iraqis | 76.0 /100 | #150 | Good 13.2% |
| Costa Ricans | 75.8 /100 | #151 | Good 13.2% |
| Slavs | 75.7 /100 | #152 | Good 13.2% |
| Northern Europeans | 73.7 /100 | #153 | Good 13.2% |
| Arabs | 73.5 /100 | #154 | Good 13.2% |
| Immigrants | Sierra Leone | 72.9 /100 | #155 | Good 13.3% |
| Immigrants | Cameroon | 72.0 /100 | #156 | Good 13.3% |
| Immigrants | Western Europe | 70.3 /100 | #157 | Good 13.3% |
| Immigrants | Colombia | 69.2 /100 | #158 | Good 13.3% |
| Uruguayans | 66.9 /100 | #159 | Good 13.3% |
| Immigrants | South America | 66.3 /100 | #160 | Good 13.3% |
Demographics Similar to Senegalese by Female Poverty Among 25-34 Year Olds
In terms of female poverty among 25-34 year olds, the demographic groups most similar to Senegalese are Cree (15.6%, a difference of 0.060%), British West Indian (15.6%, a difference of 0.070%), Nonimmigrants (15.6%, a difference of 0.11%), Subsaharan African (15.6%, a difference of 0.22%), and Immigrants from Senegal (15.6%, a difference of 0.44%).
| Demographics | Rating | Rank | Female Poverty Among 25-34 Year Olds |
| Immigrants | Liberia | 0.1 /100 | #265 | Tragic 15.4% |
| Immigrants | Somalia | 0.1 /100 | #266 | Tragic 15.4% |
| Central Americans | 0.1 /100 | #267 | Tragic 15.5% |
| Immigrants | Senegal | 0.1 /100 | #268 | Tragic 15.6% |
| Sub-Saharan Africans | 0.1 /100 | #269 | Tragic 15.6% |
| British West Indians | 0.1 /100 | #270 | Tragic 15.6% |
| Cree | 0.1 /100 | #271 | Tragic 15.6% |
| Senegalese | 0.1 /100 | #272 | Tragic 15.6% |
| Immigrants | Nonimmigrants | 0.1 /100 | #273 | Tragic 15.6% |
| Immigrants | Caribbean | 0.0 /100 | #274 | Tragic 15.7% |
| Immigrants | Azores | 0.0 /100 | #275 | Tragic 15.8% |
| Immigrants | Zaire | 0.0 /100 | #276 | Tragic 15.8% |
| Immigrants | Micronesia | 0.0 /100 | #277 | Tragic 15.8% |
| French American Indians | 0.0 /100 | #278 | Tragic 15.9% |
| Fijians | 0.0 /100 | #279 | Tragic 15.9% |