Yakama vs Senegalese In Labor Force | Age 35-44
COMPARE
Yakama
Senegalese
In Labor Force | Age 35-44
In Labor Force | Age 35-44 Comparison
Yakama
Senegalese
79.0%
IN LABOR FORCE | AGE 35-44
0.0/ 100
METRIC RATING
334th/ 347
METRIC RANK
84.9%
IN LABOR FORCE | AGE 35-44
97.8/ 100
METRIC RATING
83rd/ 347
METRIC RANK
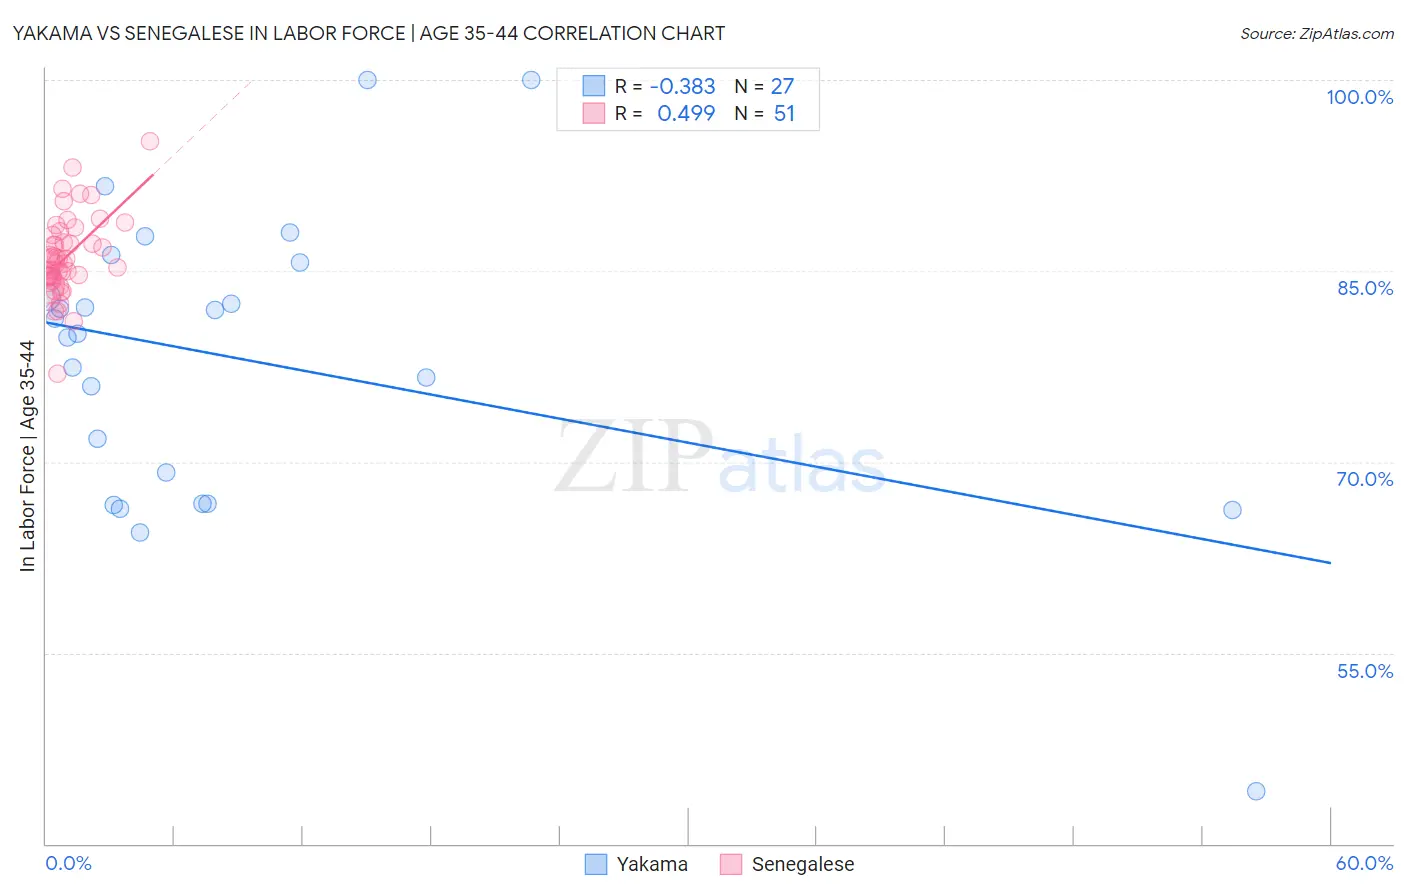
Yakama vs Senegalese In Labor Force | Age 35-44 Correlation Chart
The statistical analysis conducted on geographies consisting of 19,917,241 people shows a mild negative correlation between the proportion of Yakama and labor force participation rate among population between the ages 35 and 44 in the United States with a correlation coefficient (R) of -0.383 and weighted average of 79.0%. Similarly, the statistical analysis conducted on geographies consisting of 78,113,462 people shows a moderate positive correlation between the proportion of Senegalese and labor force participation rate among population between the ages 35 and 44 in the United States with a correlation coefficient (R) of 0.499 and weighted average of 84.9%, a difference of 7.5%.
In Labor Force | Age 35-44 Correlation Summary
| Measurement | Yakama | Senegalese |
| Minimum | 44.1% | 76.9% |
| Maximum | 100.0% | 95.2% |
| Range | 55.9% | 18.3% |
| Mean | 77.9% | 86.1% |
| Median | 80.1% | 85.6% |
| Interquartile 25% (IQ1) | 66.7% | 84.6% |
| Interquartile 75% (IQ3) | 85.7% | 87.8% |
| Interquartile Range (IQR) | 19.0% | 3.3% |
| Standard Deviation (Sample) | 11.9% | 3.2% |
| Standard Deviation (Population) | 11.7% | 3.1% |
Similar Demographics by In Labor Force | Age 35-44
Demographics Similar to Yakama by In Labor Force | Age 35-44
In terms of in labor force | age 35-44, the demographic groups most similar to Yakama are Native/Alaskan (78.9%, a difference of 0.11%), Kiowa (79.2%, a difference of 0.29%), Ute (79.4%, a difference of 0.62%), Houma (79.5%, a difference of 0.68%), and Cheyenne (79.5%, a difference of 0.70%).
| Demographics | Rating | Rank | In Labor Force | Age 35-44 |
| Sioux | 0.0 /100 | #327 | Tragic 80.2% |
| Creek | 0.0 /100 | #328 | Tragic 80.0% |
| Menominee | 0.0 /100 | #329 | Tragic 79.7% |
| Cheyenne | 0.0 /100 | #330 | Tragic 79.5% |
| Houma | 0.0 /100 | #331 | Tragic 79.5% |
| Ute | 0.0 /100 | #332 | Tragic 79.4% |
| Kiowa | 0.0 /100 | #333 | Tragic 79.2% |
| Yakama | 0.0 /100 | #334 | Tragic 79.0% |
| Natives/Alaskans | 0.0 /100 | #335 | Tragic 78.9% |
| Arapaho | 0.0 /100 | #336 | Tragic 78.1% |
| Apache | 0.0 /100 | #337 | Tragic 77.9% |
| Pueblo | 0.0 /100 | #338 | Tragic 77.4% |
| Yup'ik | 0.0 /100 | #339 | Tragic 77.3% |
| Lumbee | 0.0 /100 | #340 | Tragic 77.0% |
| Hopi | 0.0 /100 | #341 | Tragic 77.0% |
Demographics Similar to Senegalese by In Labor Force | Age 35-44
In terms of in labor force | age 35-44, the demographic groups most similar to Senegalese are Immigrants from Peru (84.9%, a difference of 0.0%), Immigrants from Middle Africa (84.9%, a difference of 0.0%), Greek (84.9%, a difference of 0.0%), Belgian (84.9%, a difference of 0.010%), and Yugoslavian (84.9%, a difference of 0.010%).
| Demographics | Rating | Rank | In Labor Force | Age 35-44 |
| Immigrants | Cuba | 98.6 /100 | #76 | Exceptional 84.9% |
| Immigrants | Turkey | 98.6 /100 | #77 | Exceptional 84.9% |
| Immigrants | Africa | 98.4 /100 | #78 | Exceptional 84.9% |
| Peruvians | 98.3 /100 | #79 | Exceptional 84.9% |
| Immigrants | Colombia | 98.3 /100 | #80 | Exceptional 84.9% |
| Immigrants | Eastern Europe | 98.3 /100 | #81 | Exceptional 84.9% |
| Immigrants | Sudan | 98.1 /100 | #82 | Exceptional 84.9% |
| Senegalese | 97.8 /100 | #83 | Exceptional 84.9% |
| Immigrants | Peru | 97.8 /100 | #84 | Exceptional 84.9% |
| Immigrants | Middle Africa | 97.8 /100 | #85 | Exceptional 84.9% |
| Greeks | 97.8 /100 | #86 | Exceptional 84.9% |
| Belgians | 97.7 /100 | #87 | Exceptional 84.9% |
| Yugoslavians | 97.7 /100 | #88 | Exceptional 84.9% |
| Immigrants | Pakistan | 97.5 /100 | #89 | Exceptional 84.9% |
| Immigrants | France | 97.4 /100 | #90 | Exceptional 84.9% |