Potawatomi vs Immigrants from West Indies Receiving Food Stamps
COMPARE
Potawatomi
Immigrants from West Indies
Receiving Food Stamps
Receiving Food Stamps Comparison
Potawatomi
Immigrants from West Indies
12.5%
RECEIVING FOOD STAMPS
14.6/ 100
METRIC RATING
208th/ 347
METRIC RANK
16.1%
RECEIVING FOOD STAMPS
0.0/ 100
METRIC RATING
302nd/ 347
METRIC RANK
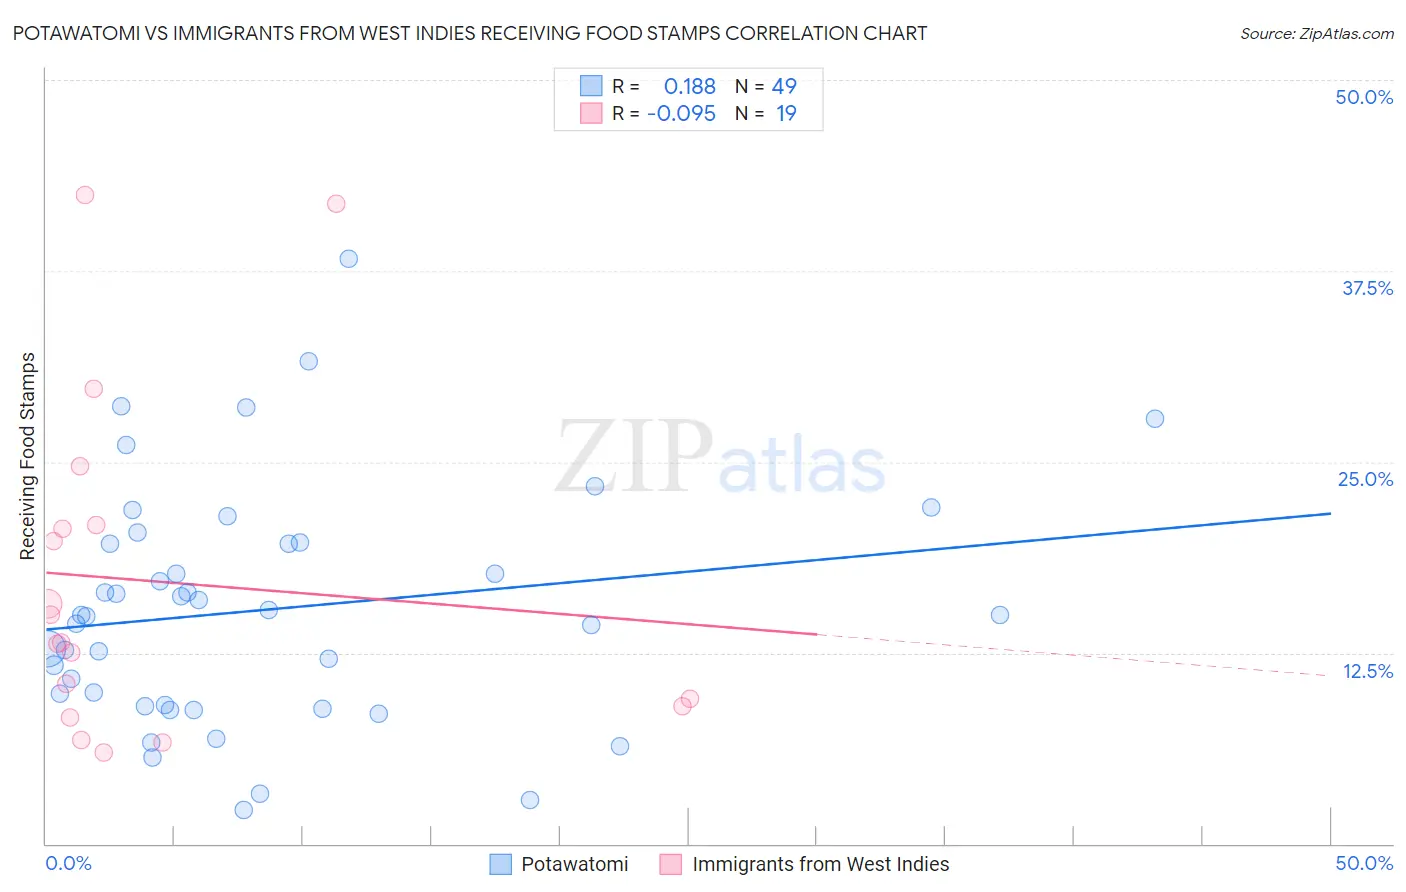
Potawatomi vs Immigrants from West Indies Receiving Food Stamps Correlation Chart
The statistical analysis conducted on geographies consisting of 117,725,542 people shows a poor positive correlation between the proportion of Potawatomi and percentage of population receiving government assistance and/or food stamps in the United States with a correlation coefficient (R) of 0.188 and weighted average of 12.5%. Similarly, the statistical analysis conducted on geographies consisting of 72,442,413 people shows a slight negative correlation between the proportion of Immigrants from West Indies and percentage of population receiving government assistance and/or food stamps in the United States with a correlation coefficient (R) of -0.095 and weighted average of 16.1%, a difference of 29.4%.
Receiving Food Stamps Correlation Summary
| Measurement | Potawatomi | Immigrants from West Indies |
| Minimum | 2.2% | 6.0% |
| Maximum | 38.3% | 42.5% |
| Range | 36.1% | 36.5% |
| Mean | 15.3% | 17.2% |
| Median | 15.0% | 13.1% |
| Interquartile 25% (IQ1) | 9.1% | 9.0% |
| Interquartile 75% (IQ3) | 19.6% | 20.9% |
| Interquartile Range (IQR) | 10.6% | 11.9% |
| Standard Deviation (Sample) | 7.7% | 10.9% |
| Standard Deviation (Population) | 7.7% | 10.7% |
Similar Demographics by Receiving Food Stamps
Demographics Similar to Potawatomi by Receiving Food Stamps
In terms of receiving food stamps, the demographic groups most similar to Potawatomi are South American (12.4%, a difference of 0.36%), Immigrants from Sierra Leone (12.5%, a difference of 0.47%), Immigrants from Uruguay (12.5%, a difference of 0.50%), Immigrants from Thailand (12.4%, a difference of 0.62%), and Aleut (12.4%, a difference of 0.68%).
| Demographics | Rating | Rank | Receiving Food Stamps |
| Ugandans | 22.5 /100 | #201 | Fair 12.2% |
| Immigrants | Venezuela | 20.1 /100 | #202 | Fair 12.3% |
| Shoshone | 17.7 /100 | #203 | Poor 12.4% |
| Immigrants | Nonimmigrants | 17.6 /100 | #204 | Poor 12.4% |
| Aleuts | 17.3 /100 | #205 | Poor 12.4% |
| Immigrants | Thailand | 17.0 /100 | #206 | Poor 12.4% |
| South Americans | 16.0 /100 | #207 | Poor 12.4% |
| Potawatomi | 14.6 /100 | #208 | Poor 12.5% |
| Immigrants | Sierra Leone | 12.9 /100 | #209 | Poor 12.5% |
| Immigrants | Uruguay | 12.8 /100 | #210 | Poor 12.5% |
| Colombians | 10.2 /100 | #211 | Poor 12.6% |
| Malaysians | 8.5 /100 | #212 | Tragic 12.7% |
| Moroccans | 7.6 /100 | #213 | Tragic 12.8% |
| Immigrants | Africa | 7.6 /100 | #214 | Tragic 12.8% |
| Native Hawaiians | 6.7 /100 | #215 | Tragic 12.8% |
Demographics Similar to Immigrants from West Indies by Receiving Food Stamps
In terms of receiving food stamps, the demographic groups most similar to Immigrants from West Indies are Nicaraguan (16.1%, a difference of 0.090%), West Indian (16.3%, a difference of 0.77%), Trinidadian and Tobagonian (16.0%, a difference of 0.94%), Immigrants from Bangladesh (15.9%, a difference of 1.4%), and Immigrants from the Azores (16.4%, a difference of 1.7%).
| Demographics | Rating | Rank | Receiving Food Stamps |
| Immigrants | Honduras | 0.0 /100 | #295 | Tragic 15.7% |
| Tsimshian | 0.0 /100 | #296 | Tragic 15.7% |
| Immigrants | Bahamas | 0.0 /100 | #297 | Tragic 15.8% |
| Immigrants | Trinidad and Tobago | 0.0 /100 | #298 | Tragic 15.8% |
| Hispanics or Latinos | 0.0 /100 | #299 | Tragic 15.8% |
| Immigrants | Bangladesh | 0.0 /100 | #300 | Tragic 15.9% |
| Trinidadians and Tobagonians | 0.0 /100 | #301 | Tragic 16.0% |
| Immigrants | West Indies | 0.0 /100 | #302 | Tragic 16.1% |
| Nicaraguans | 0.0 /100 | #303 | Tragic 16.1% |
| West Indians | 0.0 /100 | #304 | Tragic 16.3% |
| Immigrants | Azores | 0.0 /100 | #305 | Tragic 16.4% |
| Jamaicans | 0.0 /100 | #306 | Tragic 16.4% |
| Houma | 0.0 /100 | #307 | Tragic 16.5% |
| Barbadians | 0.0 /100 | #308 | Tragic 16.5% |
| U.S. Virgin Islanders | 0.0 /100 | #309 | Tragic 16.5% |