Kenyan vs Immigrants from West Indies Receiving Food Stamps
COMPARE
Kenyan
Immigrants from West Indies
Receiving Food Stamps
Receiving Food Stamps Comparison
Kenyans
Immigrants from West Indies
11.6%
RECEIVING FOOD STAMPS
60.2/ 100
METRIC RATING
167th/ 347
METRIC RANK
16.1%
RECEIVING FOOD STAMPS
0.0/ 100
METRIC RATING
302nd/ 347
METRIC RANK
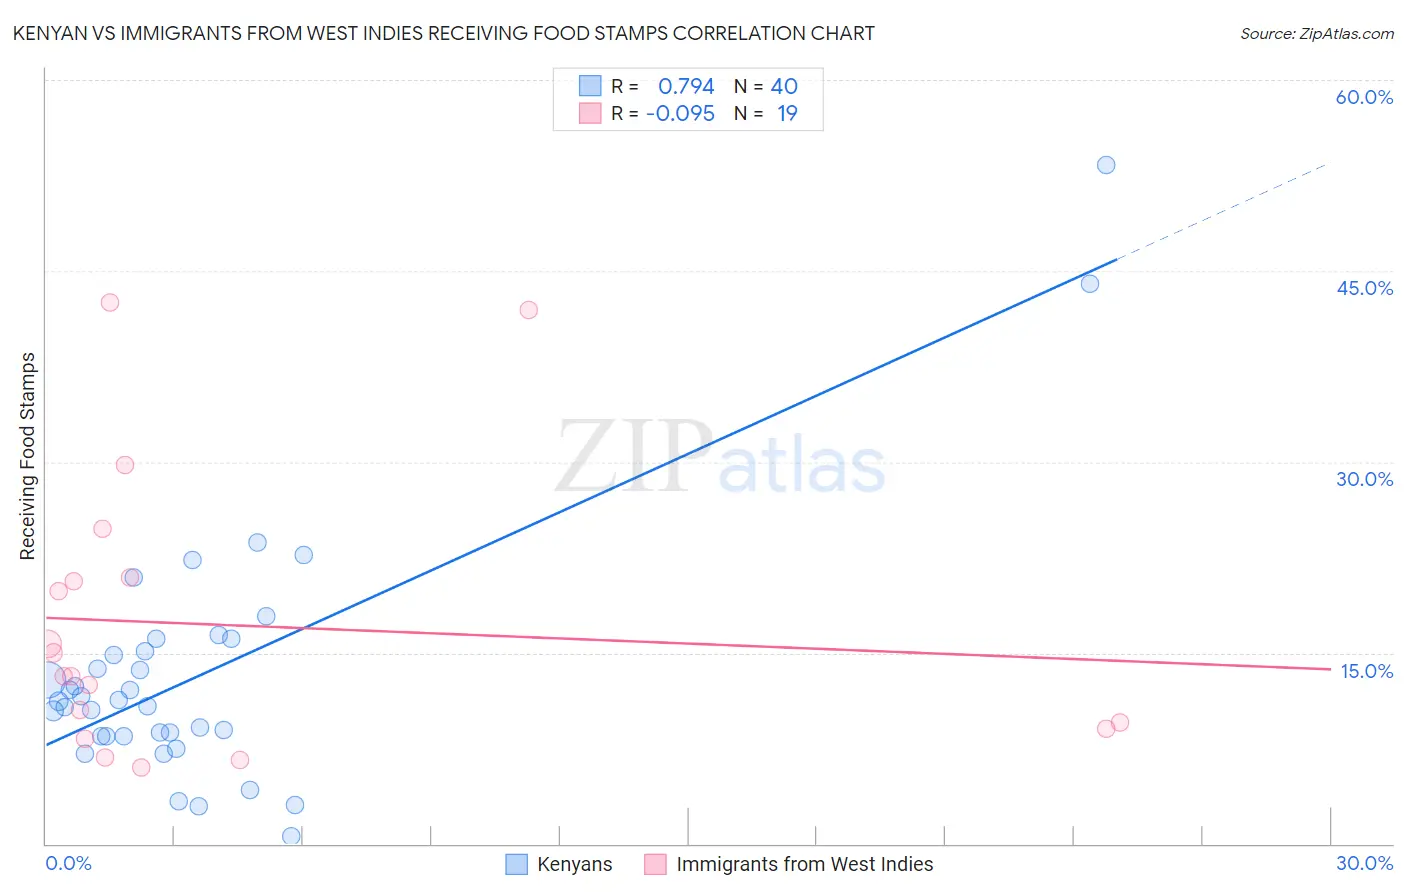
Kenyan vs Immigrants from West Indies Receiving Food Stamps Correlation Chart
The statistical analysis conducted on geographies consisting of 168,088,158 people shows a strong positive correlation between the proportion of Kenyans and percentage of population receiving government assistance and/or food stamps in the United States with a correlation coefficient (R) of 0.794 and weighted average of 11.6%. Similarly, the statistical analysis conducted on geographies consisting of 72,442,413 people shows a slight negative correlation between the proportion of Immigrants from West Indies and percentage of population receiving government assistance and/or food stamps in the United States with a correlation coefficient (R) of -0.095 and weighted average of 16.1%, a difference of 39.4%.
Receiving Food Stamps Correlation Summary
| Measurement | Kenyan | Immigrants from West Indies |
| Minimum | 0.60% | 6.0% |
| Maximum | 53.3% | 42.5% |
| Range | 52.7% | 36.5% |
| Mean | 13.3% | 17.2% |
| Median | 11.2% | 13.1% |
| Interquartile 25% (IQ1) | 8.5% | 9.0% |
| Interquartile 75% (IQ3) | 15.6% | 20.9% |
| Interquartile Range (IQR) | 7.2% | 11.9% |
| Standard Deviation (Sample) | 9.9% | 10.9% |
| Standard Deviation (Population) | 9.7% | 10.7% |
Similar Demographics by Receiving Food Stamps
Demographics Similar to Kenyans by Receiving Food Stamps
In terms of receiving food stamps, the demographic groups most similar to Kenyans are Tlingit-Haida (11.6%, a difference of 0.16%), Immigrants from Eastern Africa (11.6%, a difference of 0.28%), Costa Rican (11.6%, a difference of 0.35%), Immigrants from Belarus (11.5%, a difference of 0.38%), and Immigrants from Western Asia (11.6%, a difference of 0.56%).
| Demographics | Rating | Rank | Receiving Food Stamps |
| French Canadians | 69.5 /100 | #160 | Good 11.4% |
| Pennsylvania Germans | 68.4 /100 | #161 | Good 11.4% |
| Alsatians | 68.0 /100 | #162 | Good 11.4% |
| Immigrants | Southern Europe | 65.8 /100 | #163 | Good 11.5% |
| Immigrants | Chile | 65.0 /100 | #164 | Good 11.5% |
| Arabs | 64.7 /100 | #165 | Good 11.5% |
| Immigrants | Belarus | 62.8 /100 | #166 | Good 11.5% |
| Kenyans | 60.2 /100 | #167 | Good 11.6% |
| Tlingit-Haida | 59.1 /100 | #168 | Average 11.6% |
| Immigrants | Eastern Africa | 58.3 /100 | #169 | Average 11.6% |
| Costa Ricans | 57.9 /100 | #170 | Average 11.6% |
| Immigrants | Western Asia | 56.4 /100 | #171 | Average 11.6% |
| Guamanians/Chamorros | 54.2 /100 | #172 | Average 11.7% |
| Immigrants | Syria | 53.4 /100 | #173 | Average 11.7% |
| Immigrants | Eritrea | 50.0 /100 | #174 | Average 11.7% |
Demographics Similar to Immigrants from West Indies by Receiving Food Stamps
In terms of receiving food stamps, the demographic groups most similar to Immigrants from West Indies are Nicaraguan (16.1%, a difference of 0.090%), West Indian (16.3%, a difference of 0.77%), Trinidadian and Tobagonian (16.0%, a difference of 0.94%), Immigrants from Bangladesh (15.9%, a difference of 1.4%), and Immigrants from the Azores (16.4%, a difference of 1.7%).
| Demographics | Rating | Rank | Receiving Food Stamps |
| Immigrants | Honduras | 0.0 /100 | #295 | Tragic 15.7% |
| Tsimshian | 0.0 /100 | #296 | Tragic 15.7% |
| Immigrants | Bahamas | 0.0 /100 | #297 | Tragic 15.8% |
| Immigrants | Trinidad and Tobago | 0.0 /100 | #298 | Tragic 15.8% |
| Hispanics or Latinos | 0.0 /100 | #299 | Tragic 15.8% |
| Immigrants | Bangladesh | 0.0 /100 | #300 | Tragic 15.9% |
| Trinidadians and Tobagonians | 0.0 /100 | #301 | Tragic 16.0% |
| Immigrants | West Indies | 0.0 /100 | #302 | Tragic 16.1% |
| Nicaraguans | 0.0 /100 | #303 | Tragic 16.1% |
| West Indians | 0.0 /100 | #304 | Tragic 16.3% |
| Immigrants | Azores | 0.0 /100 | #305 | Tragic 16.4% |
| Jamaicans | 0.0 /100 | #306 | Tragic 16.4% |
| Houma | 0.0 /100 | #307 | Tragic 16.5% |
| Barbadians | 0.0 /100 | #308 | Tragic 16.5% |
| U.S. Virgin Islanders | 0.0 /100 | #309 | Tragic 16.5% |