White/Caucasian vs Immigrants from Thailand Female Poverty
COMPARE
White/Caucasian
Immigrants from Thailand
Female Poverty
Female Poverty Comparison
Whites/Caucasians
Immigrants from Thailand
13.4%
FEMALE POVERTY
54.6/ 100
METRIC RATING
171st/ 347
METRIC RANK
14.4%
FEMALE POVERTY
4.5/ 100
METRIC RATING
216th/ 347
METRIC RANK
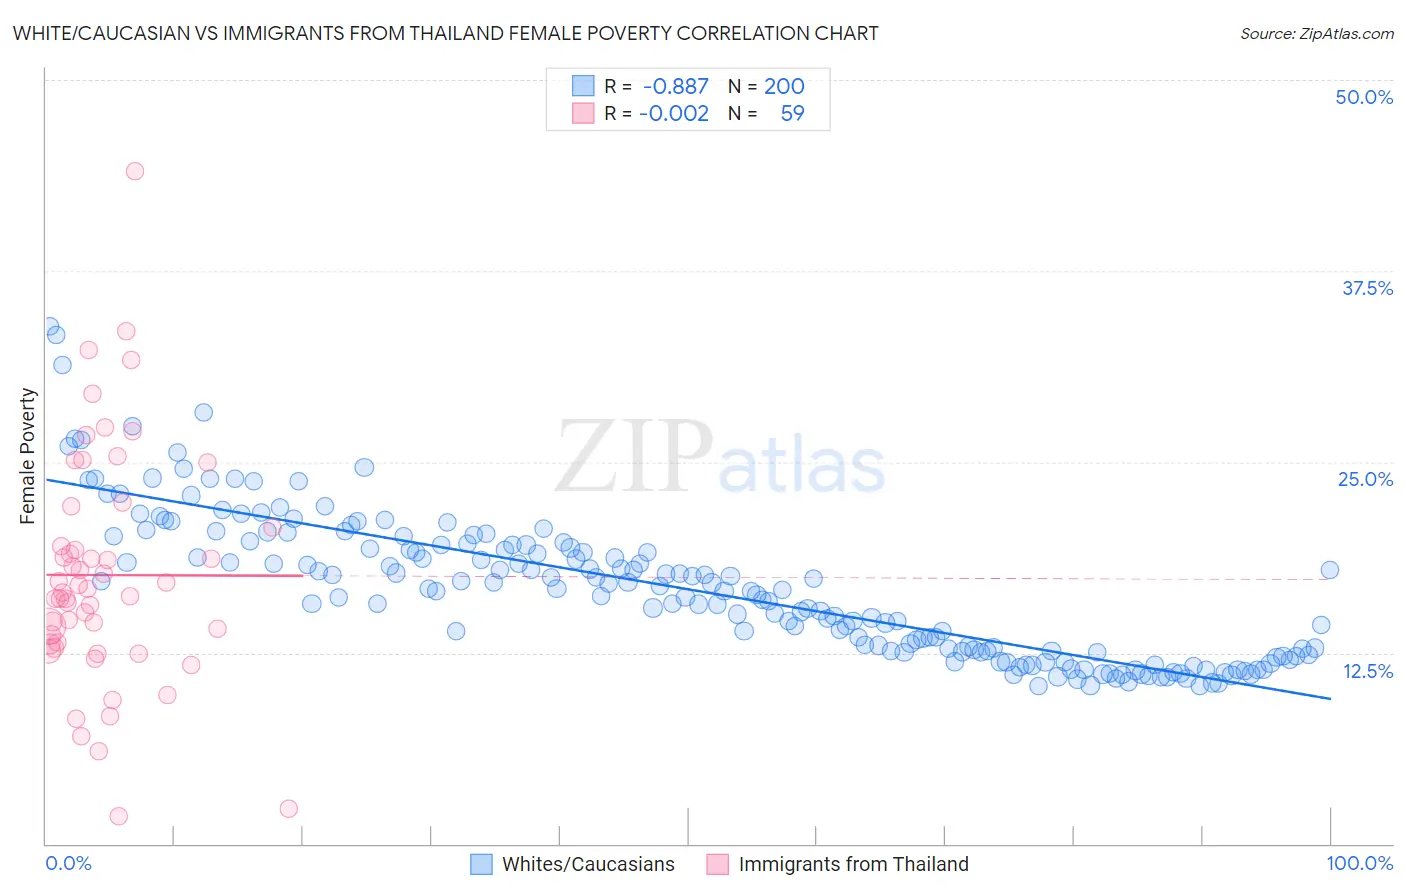
White/Caucasian vs Immigrants from Thailand Female Poverty Correlation Chart
The statistical analysis conducted on geographies consisting of 583,112,868 people shows a very strong negative correlation between the proportion of Whites/Caucasians and poverty level among females in the United States with a correlation coefficient (R) of -0.887 and weighted average of 13.4%. Similarly, the statistical analysis conducted on geographies consisting of 316,905,343 people shows no correlation between the proportion of Immigrants from Thailand and poverty level among females in the United States with a correlation coefficient (R) of -0.002 and weighted average of 14.4%, a difference of 7.8%.
Female Poverty Correlation Summary
| Measurement | White/Caucasian | Immigrants from Thailand |
| Minimum | 10.3% | 1.8% |
| Maximum | 33.9% | 44.1% |
| Range | 23.6% | 42.3% |
| Mean | 16.7% | 17.6% |
| Median | 16.5% | 16.4% |
| Interquartile 25% (IQ1) | 12.6% | 13.1% |
| Interquartile 75% (IQ3) | 19.6% | 20.7% |
| Interquartile Range (IQR) | 7.0% | 7.6% |
| Standard Deviation (Sample) | 4.7% | 7.7% |
| Standard Deviation (Population) | 4.7% | 7.6% |
Similar Demographics by Female Poverty
Demographics Similar to Whites/Caucasians by Female Poverty
In terms of female poverty, the demographic groups most similar to Whites/Caucasians are Mongolian (13.4%, a difference of 0.10%), Colombian (13.4%, a difference of 0.11%), Lebanese (13.4%, a difference of 0.13%), Aleut (13.4%, a difference of 0.21%), and Immigrants from Chile (13.3%, a difference of 0.27%).
| Demographics | Rating | Rank | Female Poverty |
| Ethiopians | 62.3 /100 | #164 | Good 13.3% |
| Scotch-Irish | 62.1 /100 | #165 | Good 13.3% |
| Immigrants | Oceania | 59.7 /100 | #166 | Average 13.3% |
| Immigrants | Chile | 57.4 /100 | #167 | Average 13.3% |
| Aleuts | 56.7 /100 | #168 | Average 13.4% |
| Lebanese | 55.9 /100 | #169 | Average 13.4% |
| Colombians | 55.7 /100 | #170 | Average 13.4% |
| Whites/Caucasians | 54.6 /100 | #171 | Average 13.4% |
| Mongolians | 53.6 /100 | #172 | Average 13.4% |
| Immigrants | Afghanistan | 50.8 /100 | #173 | Average 13.4% |
| Immigrants | Iraq | 50.0 /100 | #174 | Average 13.4% |
| Celtics | 49.9 /100 | #175 | Average 13.4% |
| Immigrants | Spain | 49.9 /100 | #176 | Average 13.4% |
| Immigrants | Morocco | 49.4 /100 | #177 | Average 13.4% |
| Israelis | 49.1 /100 | #178 | Average 13.5% |
Demographics Similar to Immigrants from Thailand by Female Poverty
In terms of female poverty, the demographic groups most similar to Immigrants from Thailand are Immigrants (14.4%, a difference of 0.030%), Immigrants from Uzbekistan (14.4%, a difference of 0.080%), Immigrants from Panama (14.4%, a difference of 0.090%), Japanese (14.5%, a difference of 0.22%), and Marshallese (14.4%, a difference of 0.23%).
| Demographics | Rating | Rank | Female Poverty |
| Panamanians | 7.7 /100 | #209 | Tragic 14.2% |
| Malaysians | 7.4 /100 | #210 | Tragic 14.3% |
| Moroccans | 7.2 /100 | #211 | Tragic 14.3% |
| Bermudans | 5.5 /100 | #212 | Tragic 14.4% |
| Alaskan Athabascans | 5.3 /100 | #213 | Tragic 14.4% |
| Marshallese | 5.0 /100 | #214 | Tragic 14.4% |
| Immigrants | Panama | 4.7 /100 | #215 | Tragic 14.4% |
| Immigrants | Thailand | 4.5 /100 | #216 | Tragic 14.4% |
| Immigrants | Immigrants | 4.5 /100 | #217 | Tragic 14.4% |
| Immigrants | Uzbekistan | 4.4 /100 | #218 | Tragic 14.4% |
| Japanese | 4.1 /100 | #219 | Tragic 14.5% |
| Alsatians | 4.0 /100 | #220 | Tragic 14.5% |
| Immigrants | Cambodia | 3.7 /100 | #221 | Tragic 14.5% |
| Immigrants | Nonimmigrants | 3.7 /100 | #222 | Tragic 14.5% |
| Immigrants | Africa | 3.3 /100 | #223 | Tragic 14.5% |