Immigrants from Grenada vs Inupiat Female Poverty
COMPARE
Immigrants from Grenada
Inupiat
Female Poverty
Female Poverty Comparison
Immigrants from Grenada
Inupiat
16.8%
FEMALE POVERTY
0.0/ 100
METRIC RATING
305th/ 347
METRIC RANK
16.2%
FEMALE POVERTY
0.0/ 100
METRIC RATING
286th/ 347
METRIC RANK
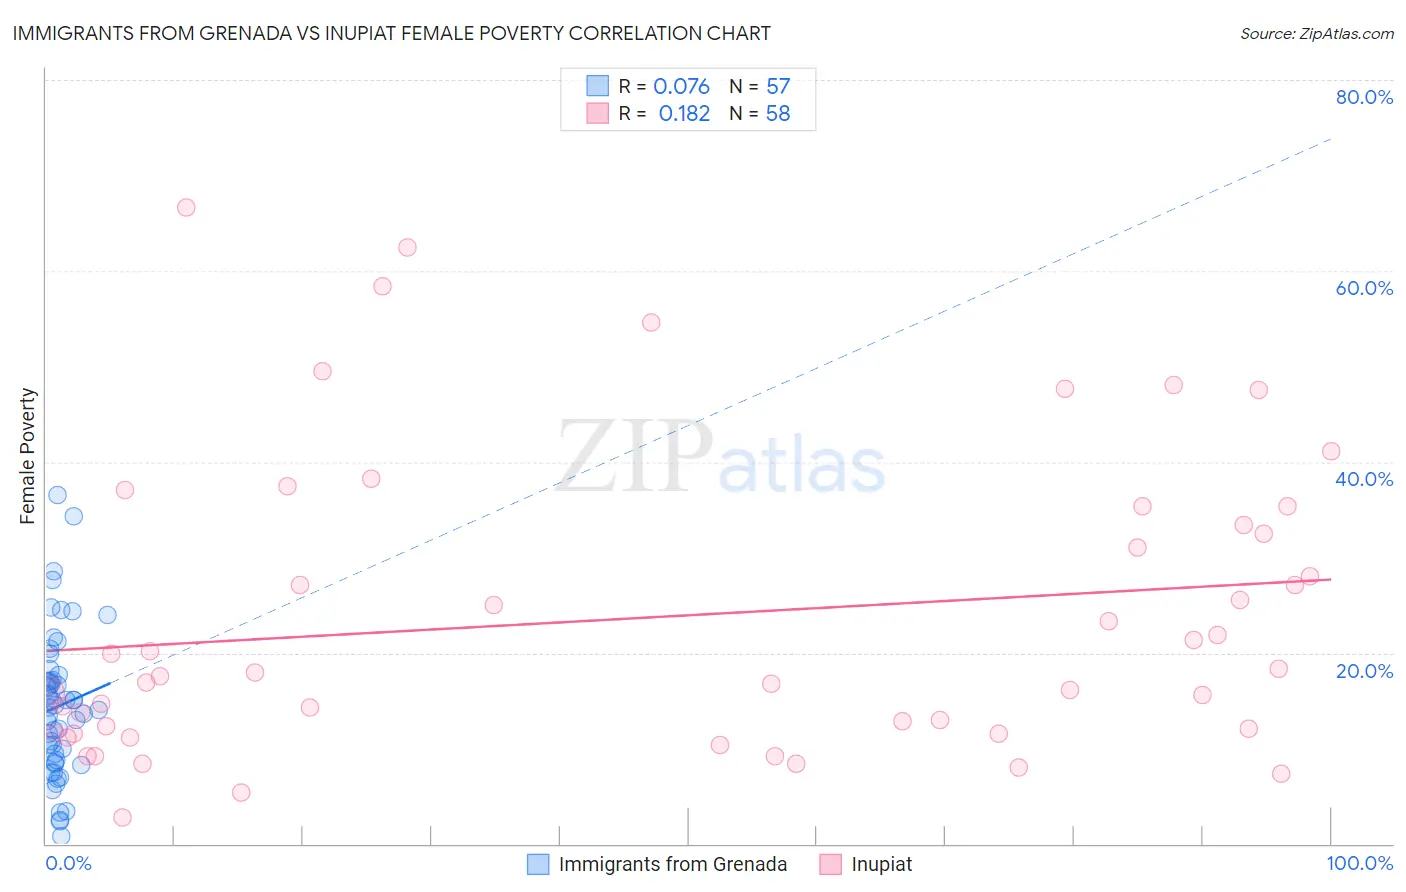
Immigrants from Grenada vs Inupiat Female Poverty Correlation Chart
The statistical analysis conducted on geographies consisting of 67,188,736 people shows a slight positive correlation between the proportion of Immigrants from Grenada and poverty level among females in the United States with a correlation coefficient (R) of 0.076 and weighted average of 16.8%. Similarly, the statistical analysis conducted on geographies consisting of 96,314,579 people shows a poor positive correlation between the proportion of Inupiat and poverty level among females in the United States with a correlation coefficient (R) of 0.182 and weighted average of 16.2%, a difference of 3.6%.
Female Poverty Correlation Summary
| Measurement | Immigrants from Grenada | Inupiat |
| Minimum | 0.74% | 2.8% |
| Maximum | 36.5% | 66.7% |
| Range | 35.8% | 63.9% |
| Mean | 14.4% | 23.7% |
| Median | 14.3% | 17.7% |
| Interquartile 25% (IQ1) | 8.6% | 11.6% |
| Interquartile 75% (IQ3) | 17.4% | 33.3% |
| Interquartile Range (IQR) | 8.8% | 21.7% |
| Standard Deviation (Sample) | 7.6% | 15.6% |
| Standard Deviation (Population) | 7.5% | 15.5% |
Demographics Similar to Immigrants from Grenada and Inupiat by Female Poverty
In terms of female poverty, the demographic groups most similar to Immigrants from Grenada are Immigrants from Central America (16.8%, a difference of 0.0%), Choctaw (16.8%, a difference of 0.070%), Chippewa (16.7%, a difference of 0.67%), Guatemalan (16.7%, a difference of 0.70%), and Bahamian (16.6%, a difference of 1.0%). Similarly, the demographic groups most similar to Inupiat are Immigrants from Belize (16.3%, a difference of 0.19%), Comanche (16.2%, a difference of 0.44%), Indonesian (16.4%, a difference of 0.74%), Blackfeet (16.4%, a difference of 0.75%), and Immigrants from Bangladesh (16.4%, a difference of 0.94%).
| Demographics | Rating | Rank | Female Poverty |
| Comanche | 0.0 /100 | #285 | Tragic 16.2% |
| Inupiat | 0.0 /100 | #286 | Tragic 16.2% |
| Immigrants | Belize | 0.0 /100 | #287 | Tragic 16.3% |
| Indonesians | 0.0 /100 | #288 | Tragic 16.4% |
| Blackfeet | 0.0 /100 | #289 | Tragic 16.4% |
| Immigrants | Bangladesh | 0.0 /100 | #290 | Tragic 16.4% |
| Yaqui | 0.0 /100 | #291 | Tragic 16.4% |
| Immigrants | Zaire | 0.0 /100 | #292 | Tragic 16.4% |
| Immigrants | Latin America | 0.0 /100 | #293 | Tragic 16.4% |
| Immigrants | Cabo Verde | 0.0 /100 | #294 | Tragic 16.4% |
| Senegalese | 0.0 /100 | #295 | Tragic 16.5% |
| Immigrants | Senegal | 0.0 /100 | #296 | Tragic 16.5% |
| Mexicans | 0.0 /100 | #297 | Tragic 16.5% |
| Somalis | 0.0 /100 | #298 | Tragic 16.6% |
| Hispanics or Latinos | 0.0 /100 | #299 | Tragic 16.6% |
| Bahamians | 0.0 /100 | #300 | Tragic 16.6% |
| Guatemalans | 0.0 /100 | #301 | Tragic 16.7% |
| Chippewa | 0.0 /100 | #302 | Tragic 16.7% |
| Choctaw | 0.0 /100 | #303 | Tragic 16.8% |
| Immigrants | Central America | 0.0 /100 | #304 | Tragic 16.8% |
| Immigrants | Grenada | 0.0 /100 | #305 | Tragic 16.8% |