Macedonian vs Immigrants from Ethiopia Family Poverty
COMPARE
Macedonian
Immigrants from Ethiopia
Family Poverty
Family Poverty Comparison
Macedonians
Immigrants from Ethiopia
7.8%
FAMILY POVERTY
98.6/ 100
METRIC RATING
62nd/ 347
METRIC RANK
8.9%
FAMILY POVERTY
62.5/ 100
METRIC RATING
167th/ 347
METRIC RANK
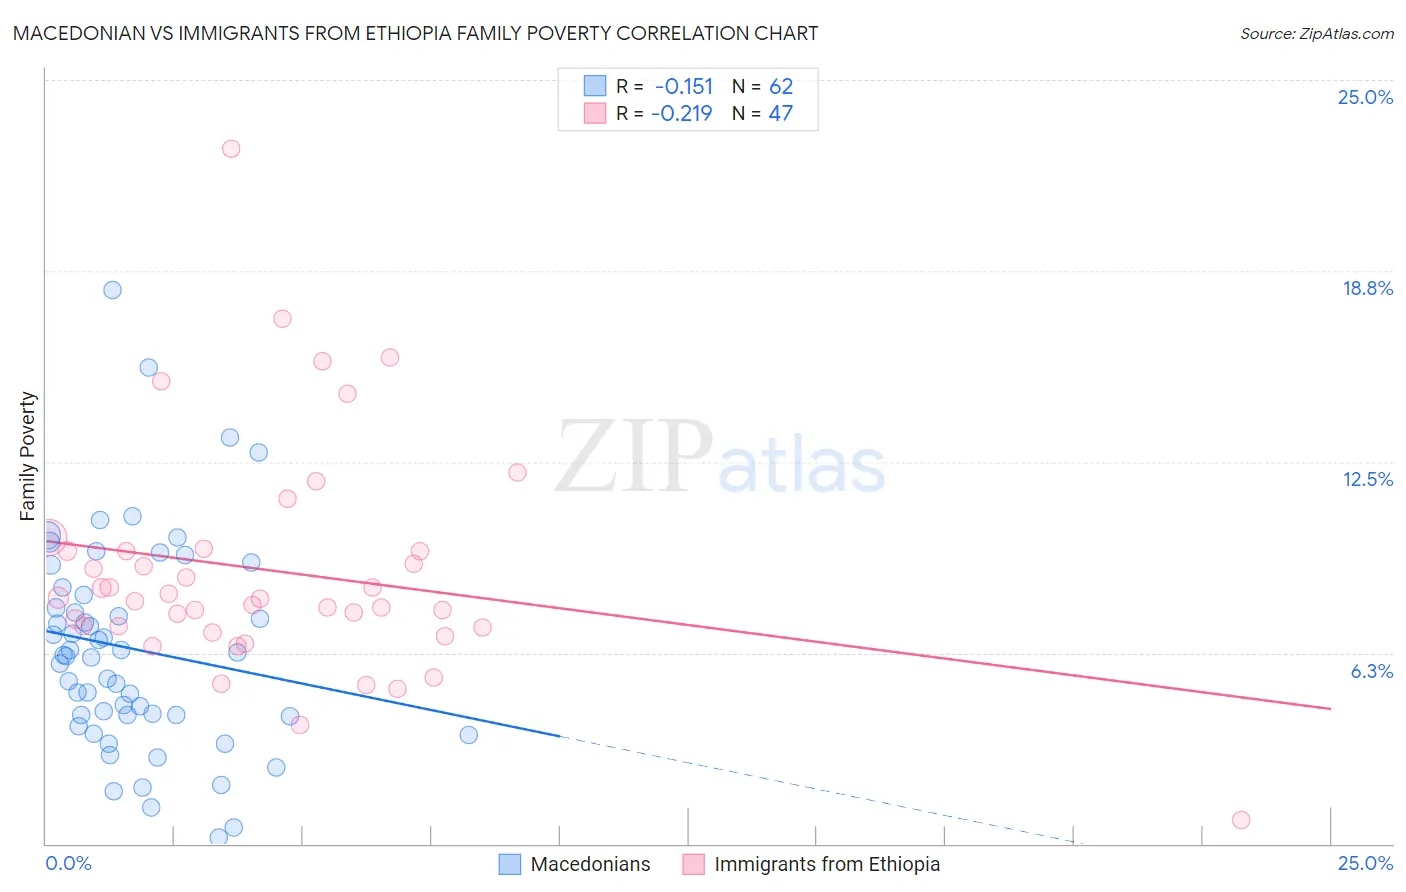
Macedonian vs Immigrants from Ethiopia Family Poverty Correlation Chart
The statistical analysis conducted on geographies consisting of 132,470,944 people shows a poor negative correlation between the proportion of Macedonians and poverty level among families in the United States with a correlation coefficient (R) of -0.151 and weighted average of 7.8%. Similarly, the statistical analysis conducted on geographies consisting of 211,298,755 people shows a weak negative correlation between the proportion of Immigrants from Ethiopia and poverty level among families in the United States with a correlation coefficient (R) of -0.219 and weighted average of 8.9%, a difference of 14.1%.
Family Poverty Correlation Summary
| Measurement | Macedonian | Immigrants from Ethiopia |
| Minimum | 0.19% | 0.78% |
| Maximum | 18.1% | 22.7% |
| Range | 17.9% | 22.0% |
| Mean | 6.4% | 8.9% |
| Median | 6.2% | 8.0% |
| Interquartile 25% (IQ1) | 4.2% | 7.1% |
| Interquartile 75% (IQ3) | 8.1% | 9.6% |
| Interquartile Range (IQR) | 3.9% | 2.5% |
| Standard Deviation (Sample) | 3.5% | 3.8% |
| Standard Deviation (Population) | 3.4% | 3.7% |
Similar Demographics by Family Poverty
Demographics Similar to Macedonians by Family Poverty
In terms of family poverty, the demographic groups most similar to Macedonians are Immigrants from Netherlands (7.7%, a difference of 0.19%), Immigrants from Greece (7.7%, a difference of 0.37%), European (7.7%, a difference of 0.38%), Finnish (7.7%, a difference of 0.39%), and Asian (7.7%, a difference of 0.42%).
| Demographics | Rating | Rank | Family Poverty |
| Immigrants | Eastern Asia | 98.7 /100 | #55 | Exceptional 7.7% |
| Immigrants | Serbia | 98.7 /100 | #56 | Exceptional 7.7% |
| Asians | 98.7 /100 | #57 | Exceptional 7.7% |
| Finns | 98.7 /100 | #58 | Exceptional 7.7% |
| Europeans | 98.7 /100 | #59 | Exceptional 7.7% |
| Immigrants | Greece | 98.7 /100 | #60 | Exceptional 7.7% |
| Immigrants | Netherlands | 98.6 /100 | #61 | Exceptional 7.7% |
| Macedonians | 98.6 /100 | #62 | Exceptional 7.8% |
| Zimbabweans | 98.4 /100 | #63 | Exceptional 7.8% |
| Koreans | 98.3 /100 | #64 | Exceptional 7.8% |
| Immigrants | Bulgaria | 98.3 /100 | #65 | Exceptional 7.8% |
| Dutch | 98.3 /100 | #66 | Exceptional 7.8% |
| Northern Europeans | 98.3 /100 | #67 | Exceptional 7.8% |
| Australians | 98.2 /100 | #68 | Exceptional 7.8% |
| Immigrants | Belgium | 98.2 /100 | #69 | Exceptional 7.8% |
Demographics Similar to Immigrants from Ethiopia by Family Poverty
In terms of family poverty, the demographic groups most similar to Immigrants from Ethiopia are Israeli (8.9%, a difference of 0.060%), Afghan (8.8%, a difference of 0.14%), Guamanian/Chamorro (8.8%, a difference of 0.32%), Celtic (8.8%, a difference of 0.35%), and Immigrants from Chile (8.9%, a difference of 0.41%).
| Demographics | Rating | Rank | Family Poverty |
| Hungarians | 67.2 /100 | #160 | Good 8.8% |
| Immigrants | Northern Africa | 66.9 /100 | #161 | Good 8.8% |
| Ethiopians | 66.3 /100 | #162 | Good 8.8% |
| Pennsylvania Germans | 66.0 /100 | #163 | Good 8.8% |
| Celtics | 64.9 /100 | #164 | Good 8.8% |
| Guamanians/Chamorros | 64.7 /100 | #165 | Good 8.8% |
| Afghans | 63.5 /100 | #166 | Good 8.8% |
| Immigrants | Ethiopia | 62.5 /100 | #167 | Good 8.9% |
| Israelis | 62.1 /100 | #168 | Good 8.9% |
| Immigrants | Chile | 59.6 /100 | #169 | Average 8.9% |
| Kenyans | 58.2 /100 | #170 | Average 8.9% |
| Lebanese | 57.6 /100 | #171 | Average 8.9% |
| Immigrants | Peru | 57.5 /100 | #172 | Average 8.9% |
| Immigrants | Fiji | 56.4 /100 | #173 | Average 8.9% |
| Immigrants | Albania | 50.0 /100 | #174 | Average 9.0% |