Immigrants from Latvia vs Immigrants from Australia Single Mother Poverty
COMPARE
Immigrants from Latvia
Immigrants from Australia
Single Mother Poverty
Single Mother Poverty Comparison
Immigrants from Latvia
Immigrants from Australia
27.7%
SINGLE MOTHER POVERTY
98.7/ 100
METRIC RATING
84th/ 347
METRIC RANK
27.3%
SINGLE MOTHER POVERTY
99.5/ 100
METRIC RATING
67th/ 347
METRIC RANK
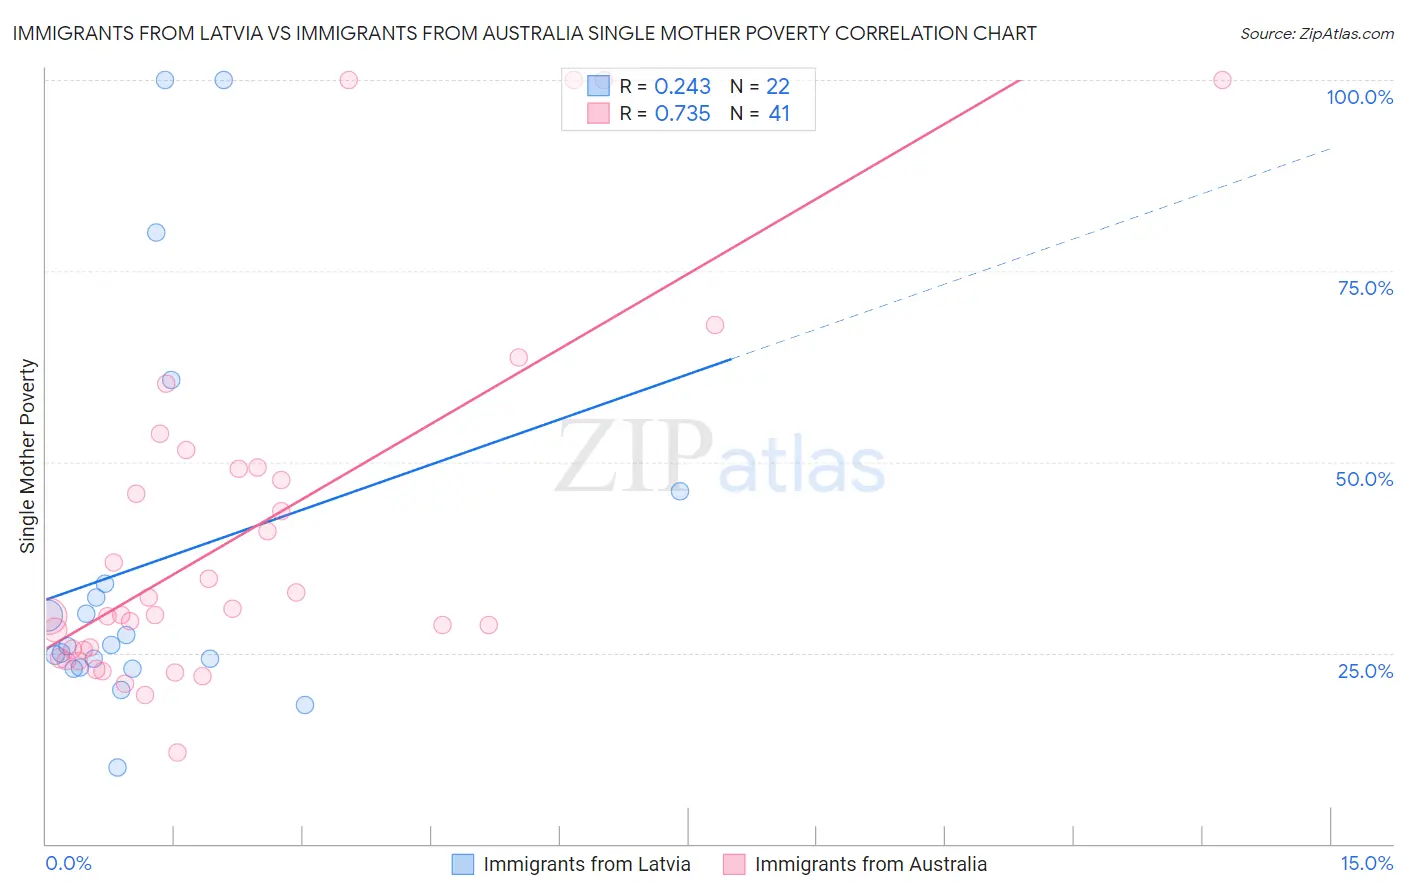
Immigrants from Latvia vs Immigrants from Australia Single Mother Poverty Correlation Chart
The statistical analysis conducted on geographies consisting of 112,466,878 people shows a weak positive correlation between the proportion of Immigrants from Latvia and poverty level among single mothers in the United States with a correlation coefficient (R) of 0.243 and weighted average of 27.7%. Similarly, the statistical analysis conducted on geographies consisting of 222,815,185 people shows a strong positive correlation between the proportion of Immigrants from Australia and poverty level among single mothers in the United States with a correlation coefficient (R) of 0.735 and weighted average of 27.3%, a difference of 1.2%.
Single Mother Poverty Correlation Summary
| Measurement | Immigrants from Latvia | Immigrants from Australia |
| Minimum | 9.9% | 11.9% |
| Maximum | 100.0% | 100.0% |
| Range | 90.1% | 88.1% |
| Mean | 36.7% | 40.6% |
| Median | 26.0% | 30.0% |
| Interquartile 25% (IQ1) | 23.0% | 24.9% |
| Interquartile 75% (IQ3) | 34.1% | 49.2% |
| Interquartile Range (IQR) | 11.1% | 24.3% |
| Standard Deviation (Sample) | 25.3% | 23.5% |
| Standard Deviation (Population) | 24.8% | 23.2% |
Demographics Similar to Immigrants from Latvia and Immigrants from Australia by Single Mother Poverty
In terms of single mother poverty, the demographic groups most similar to Immigrants from Latvia are Mongolian (27.7%, a difference of 0.0%), Greek (27.7%, a difference of 0.030%), Immigrants from Cameroon (27.6%, a difference of 0.090%), Immigrants from Scotland (27.6%, a difference of 0.21%), and Immigrants from Italy (27.5%, a difference of 0.55%). Similarly, the demographic groups most similar to Immigrants from Australia are Soviet Union (27.3%, a difference of 0.020%), Immigrants from Czechoslovakia (27.4%, a difference of 0.030%), Immigrants from Turkey (27.3%, a difference of 0.060%), Lithuanian (27.4%, a difference of 0.19%), and Immigrants from Belarus (27.4%, a difference of 0.20%).
| Demographics | Rating | Rank | Single Mother Poverty |
| Immigrants | Turkey | 99.5 /100 | #65 | Exceptional 27.3% |
| Soviet Union | 99.5 /100 | #66 | Exceptional 27.3% |
| Immigrants | Australia | 99.5 /100 | #67 | Exceptional 27.3% |
| Immigrants | Czechoslovakia | 99.5 /100 | #68 | Exceptional 27.4% |
| Lithuanians | 99.4 /100 | #69 | Exceptional 27.4% |
| Immigrants | Belarus | 99.4 /100 | #70 | Exceptional 27.4% |
| Macedonians | 99.4 /100 | #71 | Exceptional 27.4% |
| Immigrants | Russia | 99.4 /100 | #72 | Exceptional 27.4% |
| Sierra Leoneans | 99.3 /100 | #73 | Exceptional 27.4% |
| Immigrants | Europe | 99.3 /100 | #74 | Exceptional 27.4% |
| Immigrants | Sweden | 99.2 /100 | #75 | Exceptional 27.5% |
| Peruvians | 99.2 /100 | #76 | Exceptional 27.5% |
| Immigrants | Peru | 99.2 /100 | #77 | Exceptional 27.5% |
| Immigrants | North Macedonia | 99.2 /100 | #78 | Exceptional 27.5% |
| Immigrants | Italy | 99.1 /100 | #79 | Exceptional 27.5% |
| Taiwanese | 99.1 /100 | #80 | Exceptional 27.5% |
| Immigrants | Scotland | 98.9 /100 | #81 | Exceptional 27.6% |
| Immigrants | Cameroon | 98.8 /100 | #82 | Exceptional 27.6% |
| Greeks | 98.7 /100 | #83 | Exceptional 27.7% |
| Immigrants | Latvia | 98.7 /100 | #84 | Exceptional 27.7% |
| Mongolians | 98.7 /100 | #85 | Exceptional 27.7% |